Tag

US debt

Default on Debt vs. Default of “Obligations”

By | Commentary

If you listen to the news or read any article, there is a lot of hype around this 10/17 “default” date. “The US has never defaulted….this would be catastrophic”…they all claim.

So first we need to discuss what we mean by default. As discussed in The Debt Limit Will Be Raised, looking at the first full month…November, the government will still have about $200B of revenues coming in, but about $330B of scheduled cash outflows. So we really aren’t talking about the federal government grinding to a stop…just being forced to live within it’s means. Most (but not all) of the commentators are being careful with their words…saying we would default on out “obligations”…which I suppose means all currently planned government spending (is it a default if I decide to eat in instead of taking the family out to dinner tomorrow night?).

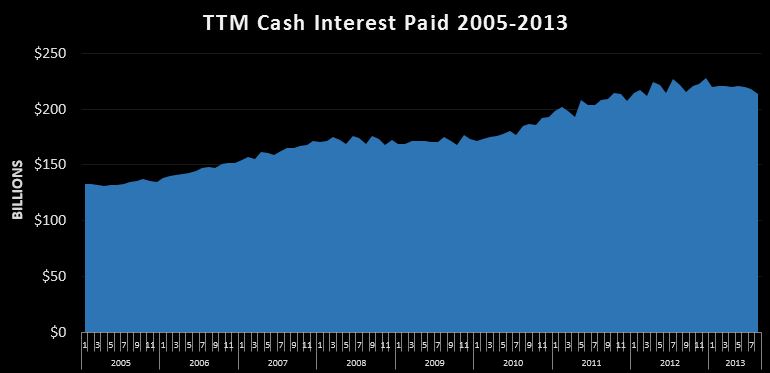
We should be very clear however, that the federal government will have more than enough cash inflows to cover all interest payments and continue to roll current debt as it expires. Over the past 12 months, the government had $3.058T of cash revenues….and only $225B of cash interest payments…a coverage ratio of over 13X.

So…this is extremely clear… any technical default on bona fide on the books debt…will be a completely voluntary event. I have read some articles saying the treasury system simply is not set up to prioritize payments….basically first in, first out. To that I say…BS.

But on the other hand…default on “obligations”…is definitely imminent. In November, there will be a ~$130B cash shortfall if treasury isn’t allowed to issue debt….more than 1/3 of scheduled cash outflows. The only think that even comes close to that is cancelling Social Security, Medicare, and Medicaid….not exactly a solid 2014 election platform….which is why I still expect the debt limit to be raised, probably before it comes an issue, but if not, by early November.

I’ve been saying for nearly a year now that the US will ultimately default on both on and off balance sheet debt. We have reached a point where the promises made for debt and social programs are simply impossible to ever make good on. I still think it is unlikely that October 2013 is the date of that default. (not that it will be one date…probably a long drawn string of broken promises) So to wrap it up…default will happen and default needs to happen…..but what is going on now is just political gamesmanship, so sit back and enjoy the show. Odds are, they will raise the limit, and agree to shave a few billion off the 10 year deficit at some date to be determined….ensuring an even bigger and “badder” default at some point in the future.  Note to self…”don’t lend Uncle Sam any money”


August 2013 Monthly Statement Of Public Debt

By | Commentary

Every month, Treasury releases the Monthly Statement of Public Debt(MSPD) which gives us a detailed breakdown of the public debt outstanding…each issue still outstanding, rates, terms ect..

“Why is this interesting?” you may be asking yourself. Well…it’s interesting for me because we get to compare the actual issue rates over time. You see…bond yields are in constant motion…changing every single day in response to market forces, fed manipulation ect… Investors can make or lose fortunes on those moves, but just like your 30 year mortgage, once issued, the borrower, in this case the US government, has effectively locked in a rate for the duration….so any fluctuations after the fact have no affect on the future cash outflows for interest and ultimately principal repayment.

So…let’s start out by looking at the 30 year bonds….with about $1.5T outstanding.

09-13-2013 30 year Bond rates

The chart shows all of the outstanding 30 year issues dating back to 1985 at 11.25%. You can clearly see the downward trend bottoming out a year ago at 2.75% in the August and November 2012 issues. More recently…the May 2013 was issued at 2.88%…this was before the increase in rates we have been hearing about. Sure enough, the August 30’s were issued at 3.63%, a .75% increase. That’s not a good sign, but it’s not exactly time to panic (at least not about rates). Rates on the 30 are still historically low, and the $16B issued last month isn’t even large enough to move the needle on the weighted average rate on the 30’s, much less the entire $12T outstanding.

Moving down to the 10 year with about $2.2T outstanding:

09-13-2013 10 year Bond rates

The rate on the 10 year has fallen steadily from the May 2006 issue at 5.13% bottoming out in August and November 2012 at 1.63%. As with the 30 year, the issue rate increased 0.75% from 1.75% in May 2013 to 2.5% in August.

There were no new 60 month issues, but I’ll throw the chart out there just for fun.

09-13-2013 5 year Bond rates

The pattern in the 60 is quite similar, moving off earlier year lows up about 75 basis points in recent months.

09-13-2013 3 year Bond rates

Finally, a look at the 3 year with $1.2T outstanding, which has been bouncing around 0.25% for a few years now, recently rising to 0.63%.

We could continue marching down the line, but the rates on everything shorter than 36 months are essentially zero….the 12 month rising from 0.11% to 0.14% is going to have a negligible effect the cash interest paid..I’ll start worrying about those when they get closer to 1% or so.

So what does it all mean? I’ve been saying for a while that when the Fed loses control of rates it will be game over for the deficit. Perhaps we’ve seen a 0.5% across the board increase in the past few months (including bills, which haven’t moved much)…have they lost control? I don’t think so…not yet anyway. Don’t get me wrong, they will lose control, and this surely is not a good sign (for them…it may be good for savers), but we’re just not there yet. They still seem to have no problem selling debt at not much higher that historic lows, even if a good chunk of that is being bought indirectly by the Fed.

So while this is definitely bad news, odds are this will be a very slow motion train wreck. With $12T of debt already locked in, much of it at rates higher than current rates, it will take years of higher rates to materially change the cash interest paid.

09-13-2013 TTM cash interest paid

Above is a snapshot of the trailing twelve month cash interest paid. Even as the debt was skyrocketing, thanks to lower rates, the actual interest paid has increased only 61% from $133B to $214B over the same time period public debt outstanding nearly tripled from 4.4T to $12T.

09-13-2013 TTM estimated interest rate

This chart shows us my estimated interest rate by dividing the TTM cash payments by the average public debt outstanding over the prior twelve months. the moderate uptick in rates has not stopped the decline in the total effective rate as older debt is being retired and rolled into lower rates, even if those rates are a bit higher than they were 3 months ago. We are currently at about 1.8%, and it took over 4 years to coast down 1% from 2.8% in April 2009.

To wrap it up, I will just say that not a lot has changed….things are as bad as they’ve been, but exceptionally low interest rates are still enabling the government to carry a massive debt load. Rates are climbing off of historic lows, but it will take another % or two rise in rates and a few years before it really starts to show up in the cash deficit. With $12T outstanding, a 1% rise in effective rates would cost an additional $120B per year in interest expense…which would be added to the deficit and grow exponentially from there. We’re not there yet, but stay tuned. If rates continue to go up, the destructive power of compound debt will be unleashed on the annual deficit, providing the final nail in the coffin, finishing up what Social Security started. In short…yes, we are still doomed.


July 2013 Monthly Statement Of Public Debt

By | Commentary

I stumbled across this series a few months ago and have started digging into the July issue released yesterday to see if there is anything interesting. Well…interesting is probably not the right word…but I think you know what I mean.

The MSPD gives us some insight into the makeup of the public debt…giving us a summary  all of the outstanding debt…from the $40B of 1 month bills issued 7/25 at 0.02% to the $10.5B of 30 year bonds issued back in 1985 at 11.25%…a rate that is 562.5X higher than the current one month. That’s interesting right?

First…some thoughts. The treasury bills (0-12 months) are not particularly interesting at this point in time. The average rate on the $1.6T outstanding is less than 0.1%, and as discussed in a prior post….the interest paid annually on this is something like $1.5B. The rate paid could double, triple, or even grow 10X, and it would still more or less be a rounding error. So…I look at it, but until the rate gets up past 0.5% or so…it’s just not material. Why would anyone lend Uncle Sam $1.6T at effectively zero? I have no idea!!

Bonds… the 30 year securities…we don’t get a lot of movement here. They are only issued every 3 months, and none are due until 2015. The average rate on the $1.4T outstanding is around 6%, though the latest issue back on 5/15/2013 was at 2.88%. It will be interesting to see what the new August issues go for…looks like it may be over 3.5%. That’s a pretty big hike, but still well under the average of the bonds outstanding, including everything issued after 2011. Of the bonds expiring in the next 3 years, the average is about 10%…so rolling those into new bonds today would result in a reduction of annual interest expenses.(but who knows what they will be in 3 years)

Notes (2-10 years)… This is where all of the action is….we have notes expiring and being issued each and every month, and the balance…at $7.7T makes up 64% of the public debt outstanding. In July, we had $94B of notes expire. Since of course the US never actually pays off debt…they just roll it…it is interesting to see what is rolling off, and what it is being replaced with.

So… In July, we have a 2 year issued at 0.38% roll off…and we had two new 2 year issues…averaging 0.31%. √

A 3 year at 1% rolled off…and a new 3 year was issued at 0.63%. √

And… a 60 month at 3.38% rolled off…replaced by a 60 month at 1.38%…a big improvement. √

And this has been the story over the last 3 years or so. Debt outstanding is increasing at around $1T per year, but the interest rates are being driven down by Fed manipulation. So..in July 2011, the cash interest paid over the prior 12 months was $204B on 9.8T of public debt outstanding. 2 years later…the cash interest paid on 11.9T of public debt was only$218B. This could continue on for a few more years…even as rates have bounced off some extraordinary lows…they are still extremely low historically speaking.


July 2013 Deficit Review

By | Commentary
The July 2013 deficit at $90B, was $8B higher than last July’s $82B deficit. It’s not a huge miss, but a deep dive into the details will tell a little bit different story.
Revenues:
Net cash revenues came in at $220B compared to $201B last year for a 9% YOY growth. Without a doubt, it’s a good number, but it is a material step down from the 15%+ we averaged over the Jan-April period. The chart below shows the YOY revenues for a selection of the larger cash revenue categories.

08-04-2013 July Revenues

The top line has total cash revenues. Most of the story can be seen in the next line…Federal Tax Deposits (FTD’s). Up $22B, 14%. It was aided by an extra day, but no matter how you look at it, this is a good solid number. Taxes not withheld were also up…this time 24%, but this is a slow month, and that only netted $1.5B. The only other material change worth noting was the 56% reduction ($4.7B) in unemployment deposits from the states. Believe it or not, this program is kinda sorta actually run like an insurance program, so I can only guess that perhaps premiums have decreased as we ease ourselves away from the Great Recession?? In any case, this category is usually good for $50-60B per year of cash revenues that I had projected to grow at 5%…I may need to revisit that assumption. But bottom line on revenues…up by a healthy amount, just not as much as before. It wouldn’t shock me one bit if we saw this ~10% growth continue through the rest of the year…It’s what comes in January 2014 that we should be concerned about.
Outlays:
Cash Outlays were up $27B YOY from last year’s $283B to $310B in July 2013. However….last July was about $35B light due to payments due 7/1 going out early because of the weekend. If we adjust for this, we actually see an $8B overall reduction.

08-04-2013 July Outlays

Of note in July, we see Social Security’s constant and scary growth….8.9%….$62B per year annualized  and accelerating. Nearly all of the reductions appear to come from Defense Vendors and Education…but it is interesting that we continue to see small reductions in cash interest expense…no surprise as discussed in detail here. Basically, even though rates have come up a bit from extraordinary lows, the debt coming due is being rolled at lower rates than it was issued, bringing the weighted average rates down enough to lower the total interest paid, even with $800B of additional debt.
DEBT:
External debt was up a mere $16B from June, from $11.901T to $11.917T as the debt limit continues to suppress “reported” debt. YOY, debt was up $800B from $11.1T to $11.9T, pretty much in line with the TTM deficit. Now…it is important to note that “extraordinary measures”(EM) used to circumvent the debt limit do not affect the cash deficit, which as far as I can tell remains correctly reported. Instead… EM essentially lets the government park debt off balance sheet unreported…while still issuing new debt (for cash). It’s hard to tell exactly how much has been hidden over the last few months, but I’d guess it is between $50-$100B….wild ass guess.
Summary:
While the headline number was disappointing, adjusted for timing, outlays were down and revenues were up….what more could you ask for? Outlays should continue to run a little under  last year at least through September…after that…who knows?? It really depends on what kind of deal the Republicans and Democrats hammer out. Higher outlays would seem like the safe bet, but anything could happen. Revenues will likely stay around +10% or so for the rest of the year. 2014….I’m not so sure. CBO is projecting another 2 years of +10% revenue gains, but just I don’t see how we get there. So…let’s just enjoy this deficit “improvement” while it lasts.

Fun With Math: 8/1/2013

By | Commentary

Per the June Monthly Statement of Public Debt, of the $11.9T of public debt outstanding, about $1.568T of it is bills…that is 12 months or less, and about $1.320T of it is 30 year bonds. So the $ of bonds outstanding  are roughly about the same…just a $250B difference…. a rounding error really 🙂

This is what I find amazing….the annual interest paid on the 30 year bonds is about $68B per year according to my calculations. Anybody wanna guess the annualized interest on the bills? A mere $1.5B….for an effective interest rate a little less than 0.1%. The weighted average rate on the 30 year bonds is about 5.12%….54X higher!!

That blows my mind…the annualized interest paid on this $1.6T of debt is a mere $1.5B. Where do I sign up? Anybody think the Bugatti Dealership will float me a $2M interest only loan for a Veyron??

On the other side of the equation, bonds make up only 11% of the debt outstanding, but their $68B of annualized interest expense makes up a full 31% of the $220B of interest paid over the last 12 months.

It has never been clearer to me that the whole point of all the interest rate manipulation…QE 1,2,3,XX ect… has absolutely nothing to do with stimulating the economy, stimulating lending, the housing market, the jobs market ect… No, the singular point of all that nonsense is simply to keep the budget deficit from exploding. It’s hard to go technically bankrupt if you can borrow an infinite amount of money at effectively 0%. But when they lose control…and they will…it’s game over. Effective rates on the debt outstanding are under 2%….even a mild increase to 4% and boom….it’s over. Just imagine if one day the world woke up and realized that lending $11.9T unsecured debt to the morons that run our government (with an astounding 15% approval rating) at effectively 0% (after inflation) is a pretty stupid thing to do. Don’t get me wrong…I’m not holding my breath. 30 years of stupid isn’t going to fix itself overnight…but it will work itself out someday.