Tag

US debt

7/25/2013 Daily US Cash Deficit

By | Commentary

The Daily US Cash Deficit for 7/25/2013 was $6.6B bringing the July 2013 deficit through 25 days to $97B with four business days remaining. I had expected to see some $4B in revenues from the states related to unemployment but it did not come through today. When it does, it should help trim a bit off the deficit. At the beginning of the month…I estimated the ending deficit at $80B. Getting $17B of surplus over the next 4 days is probably going to be a stretch, but stranger things have happened.

07-25-2013 USDD


7/10/2013 Daily US Cash Deficit

By | Daily Deficit

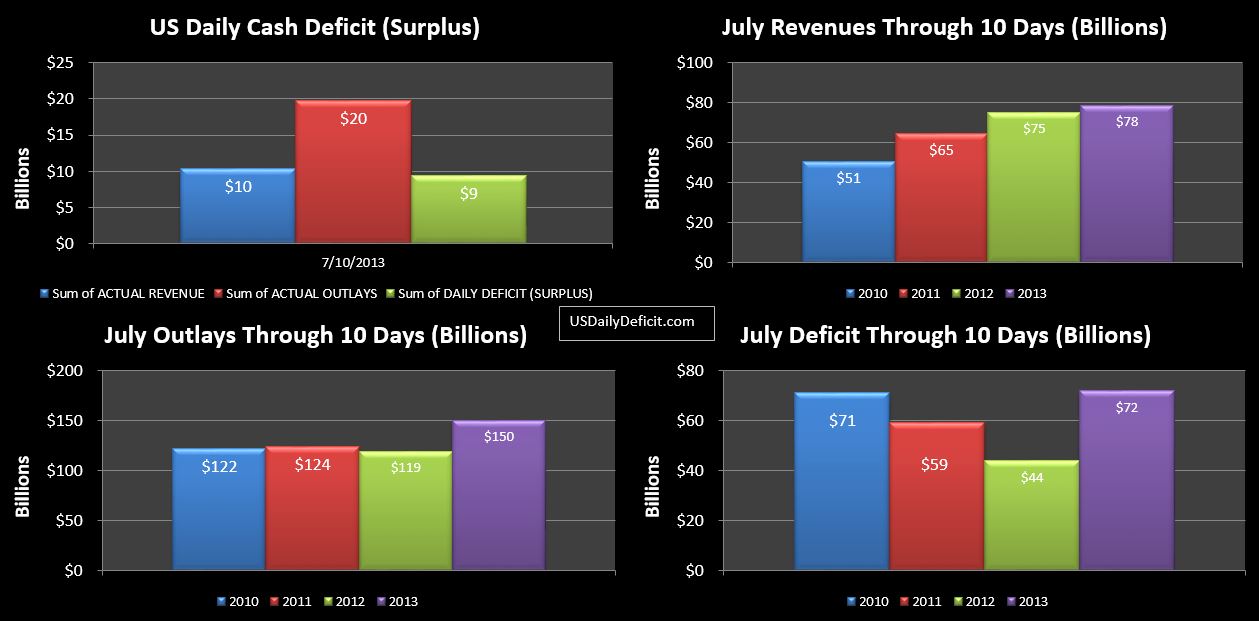
The US Daily Cash Deficit for 7/10/2013 was $9.5B pushing the June deficit through 10 days to $72B. With 1/3 of the month gone…revenues are up a meager 4%. This will be helped some by an extra day vs 7/2012…perhaps as much as a $10B (or 5%) bump, but August should give that right back. Outlays…adjusted for timing look more or less in line with last year, perhaps a few billion lower.

07-10-2013 USDD

Over at money.com Jeanne Sahadi has a front page article that is trending U.S. books $117 billion surplus in June. It’s not a terrible article, but the ignorance displayed in the comments section is a bit frightening. Everybody thinks we are saved….We aren’t. No doubt, 2013 is going to be a material improvement, but it is still going to be a $700-$800B deficit. So yeah…it’s great that we aren’t blowing through $1.6T per year anymore like we were not that long ago…. but $800B per year…with $17T accumulated…no matter how you look at it…that’s a huge hole, and we’re still digging at a ferocious pace.

07-10-2013 USDD-FC Deficit 2013-2023

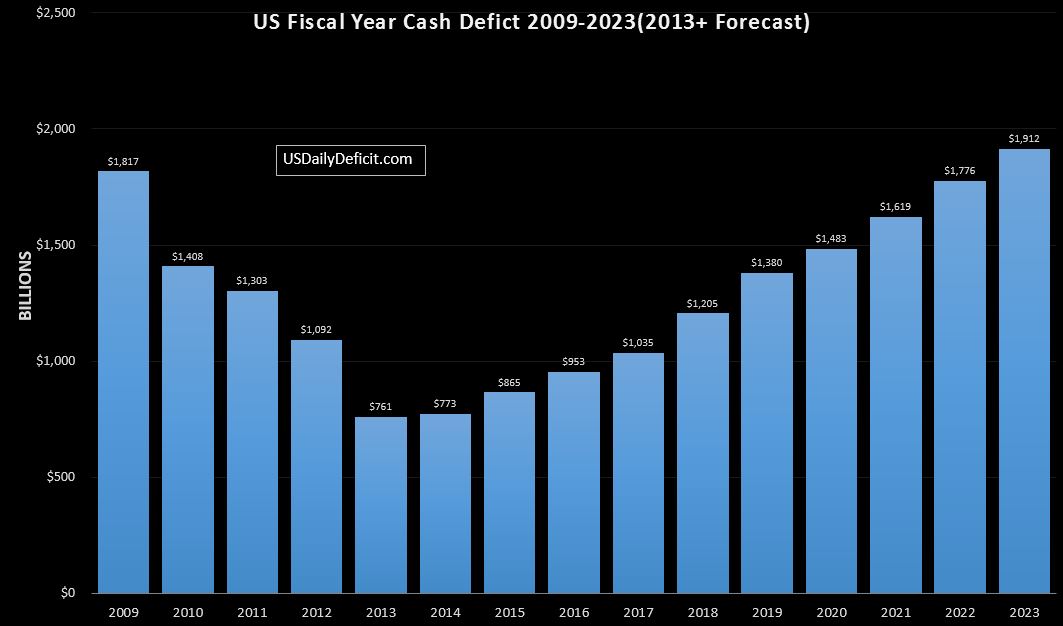
Above is the latest output from the model I use. We can see clear and steady improvement from 2009 forward as revenues picked up and cost was more or less held constant. There is no rocket science in the model. After spiking 12% or more in 2013 on tax hikes, I assume most revenues will grow at 5% in 2014 and 4% from there on…more or less in line with historical patterns. On the cost side, I assume 2% or so annual growth from 2014 on for most outlays, with a few notable exceptions. Social Security grows at 6-7%, and interest grows along with debt outstanding, but it held at about a 1.8% effective rate…extraordinarily low. For Medicare, Medicaid, and the Affordable Care Act, I use the CBO’s numbers. Using these fairly simple, and I believe realistic assumptions, I show we bottom out in 2013/2014 on increased revenues, before heading back up as spending increases on Social Security, Interest, and Healthcare outpace and run away from the modest annual revenue gains. Note…this all assumes no recesions, crashes, wars ect… although historically, it seems quite unlikely we will go another decade with out some kind of economic disturbances. I guess what I am saying is tis may end up being a conservative forecast unless the CBO is correct, and we manage to string together a few more years of 10%+ revenue gains. We all know anything is possible, but historically, it seems quite unlikely. Guess we’ll have to wait and see.

5/21/2013 Daily US Cash Deficit

By | Daily Deficit

The US Cash Deficit for 5/21/2013 was $5.2B bringing the May 2013 deficit through 21 days to $103B. Once again, 2012 and 2013 are more or less aligned, with each having 15 business days M-F. Just as last week…nothing very impressive here. Revenue up 1%, cost up 2%. All this is a far cry from what we saw last month with revenues spiking 26%. We do see tax deposits withheld up 10%, consistent with what we have been seeing all year, but this has been offset by decreases elsewhere, notably unemployment deposits from the states, federal reserve earning, and TARP. With 7 business days remaining, May is looking like a rather unimpressive follow up to a spectacular April.

05-21-2013 USDD

On the Debt limit, cash was down $6B to $31B. No sign of “extraordinary measures” yet…just a dwindling cash balance and a lot of payments due by May 31.

Explaining April 2013’s Revenue “Surge”

By | Commentary
I’ve been digging into the April “Surge” in revenues, and while unfortunately we won’t know if I am right until next April, here is my working thesis….
I probably said it a dozen times during April….the surge was primarily in the category “Tax deposits not withheld”, and this is likely the key to understanding what happened. I don’t have the numbers in front of me to prove this, but I think it is a pretty safe assumption that most of these tax deposits are made by the wealthy…let’s say top 5%. Most of the population…myself included, pay almost all our taxes through payroll withholding. Throughout the year, using IRS tables and information provided by the employee, a certain amount is withheld by the employer for FICA and income taxes. Then, after the year end, you plug your actuals into turbo tax, and probably get a refund of a few thousand bucks. These fall into “taxes withheld”…obviously because they are withheld by your employer and remitted to Uncle Sam on your behalf.
Taxes not withheld are a completely different animal. Say you own a small business, or daytrade, or own some timberland. You don’t have an employer to withhold your taxes….in fact, depending on your quarter, maybe you have a ton of income, or no income at all. So…your accountant will instead, about every quarter take a look at your books, and send enough $ to Uncle Sam to keep him off of your back until the next quarter. In one quarter, maybe you sell $1M of timber that took 30 years to grow….your accountant better send in a few hundred thousand. Unless…that is you had some day trades go bad, and also lost $500k.
So  back to my hypothesis. There was a lot of speculation running up to the end of 2012 that people would be making a lot of year end tax moves to shift income into 2012 before tax rates went up in 2013. There are a lot of ways to do this, but the simplest one looks to me like the capital gains tax…which went from 15% to 23.8% (includes a new medicare surcharge of 3.8%) for those making over $400k per year.
So imagine you fall into this category, and had purchased a lot of stocks near the bottoms in 2009. It is near the end of 2012, and those gains of ~100% or so are sitting on your books…untaxed. Taxes are going to jump from 15% to 23.8% in a few days…what do you do? Simple….you sell them all…take your 15% lump….realizing that’s the best it’s probably ever going to get, and it could very well get a lot worse from here… You set aside enough to pay your taxes…then the very next day, if you are so inclined, you buy them all back.
Thus….you recognize all of your gains to date in 2012 at the 15% rate, and establish a new basis in your stocks at much higher 2012 prices. Then, as April 2013 rolls around, your accountant sends a very large check to Uncle Sam, who books it as Tax Deposits not withheld. YOY, we saw this category increase by about $56B…let’s divide that by the rate-15%, and we can see that perhaps as much as $375B of capital gains were taken in Q4-2012 to take advantage of the expiring 15% rates.
Obviously, this resulted in a blowout month.. good for us.. (bad for my forecasting record) But, if this is indeed what happened, we should then be extremely cautious about working this one month anomaly into our 10 year forecast because not only will it not repeat itself, we could actually witness a decline in revenues next year (April)…not cool if you were expecting exponential growth in the 11-12% range like the CBO.
So for now, it’s just a matter of sitting back and watching the daily numbers roll in. June and September are the next two months with material “not withheld” revenues…each should be in the $60B range, compared to April’s $196B. What we are looking for is YOY growth. 10-15% or so would be more or less in line with a surging stock market and higher tax rates. Anything close to the 40% YOY growth we saw in April would send me back to the drawing board, and possibly making some large revisions to my own 10 year forecast.

4/8/2013 Daily US Cash Deficit

By | Commentary
The US Daily Cash Surplus for 4/8/203 was $5.8B bringing the deficit through 8 days to $60B.

2013-04-08 USDD

Just a note related to the charts…for this month only…I am including for prior years the current date+1. For example, the above has through 4/8 for 2013, but through 4/9 for the other years. I am doing this to essentially sync up 2013 and 2012 and partially eliminate the timing we typically see throughout the month. This month…it is easy…the first business day of 4/2012 was Monday 4/2…the first business day of 4/2013 was Monday 4/1. So, by including 4/9/2012, I get  not only to compare 6 business days vs 6 business days… but the same business days. Doing this if one month started on a Thursday, and the other on a Monday wouldn’t really accomplish much…but in this case I think it does. I haven’t even looked at how it affects 2010/2011, but honestly I am mostly looking at 2012/2013 anyway….So be warned…I will be presenting like this for the rest of the month.
Looking at the charts…I see two months pretty much in sync…less the much discussed cost timing issue. Still no breakout in total net revenue, but there was a slight increase in tax deposits…now looking at +5.6% YOY, being offset by refunds and a decrease in “other”. Not time to panic yet, about not seeing 10% YOY increases…give that at least a few more weeks.