Every month, Treasury releases the Monthly Statement of Public Debt(MSPD) which gives us a detailed breakdown of the public debt outstanding…each issue still outstanding, rates, terms ect..
“Why is this interesting?” you may be asking yourself. Well…it’s interesting for me because we get to compare the actual issue rates over time. You see…bond yields are in constant motion…changing every single day in response to market forces, fed manipulation ect… Investors can make or lose fortunes on those moves, but just like your 30 year mortgage, once issued, the borrower, in this case the US government, has effectively locked in a rate for the duration….so any fluctuations after the fact have no affect on the future cash outflows for interest and ultimately principal repayment.
So…let’s start out by looking at the 30 year bonds….with about $1.5T outstanding.
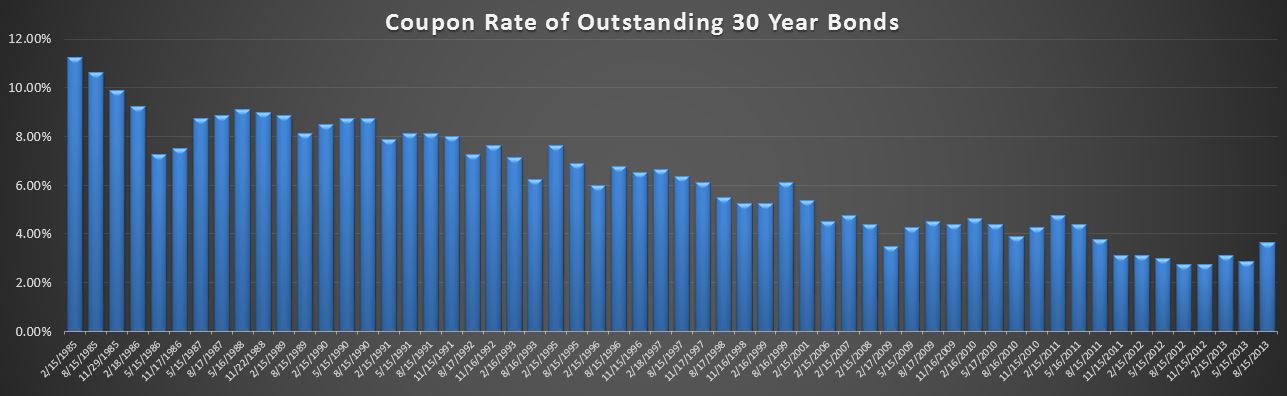
The chart shows all of the outstanding 30 year issues dating back to 1985 at 11.25%. You can clearly see the downward trend bottoming out a year ago at 2.75% in the August and November 2012 issues. More recently…the May 2013 was issued at 2.88%…this was before the increase in rates we have been hearing about. Sure enough, the August 30’s were issued at 3.63%, a .75% increase. That’s not a good sign, but it’s not exactly time to panic (at least not about rates). Rates on the 30 are still historically low, and the $16B issued last month isn’t even large enough to move the needle on the weighted average rate on the 30’s, much less the entire $12T outstanding.
Moving down to the 10 year with about $2.2T outstanding:
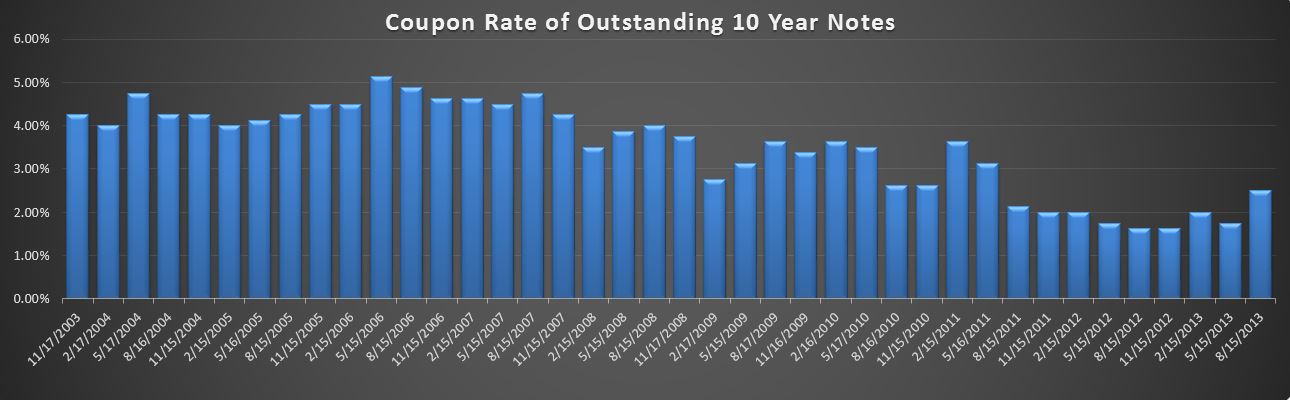
The rate on the 10 year has fallen steadily from the May 2006 issue at 5.13% bottoming out in August and November 2012 at 1.63%. As with the 30 year, the issue rate increased 0.75% from 1.75% in May 2013 to 2.5% in August.
There were no new 60 month issues, but I’ll throw the chart out there just for fun.
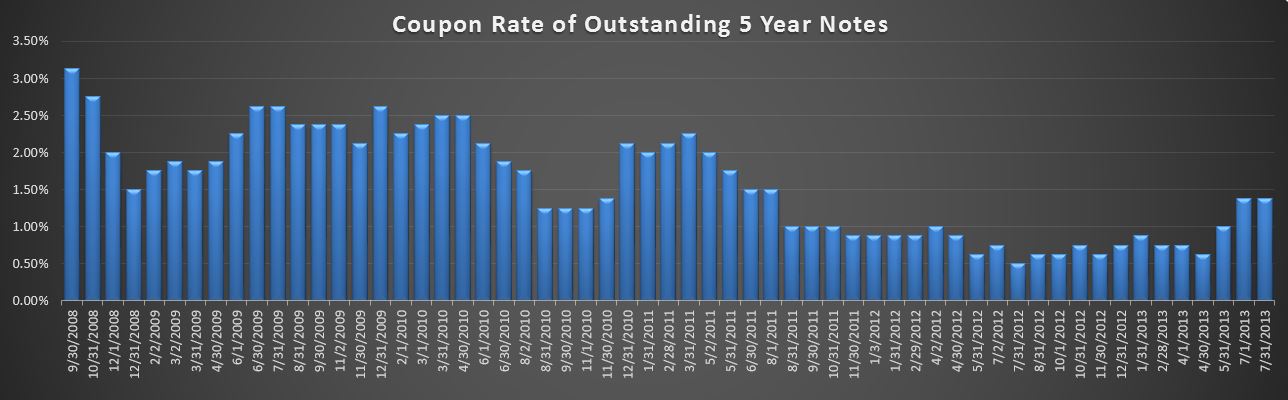
The pattern in the 60 is quite similar, moving off earlier year lows up about 75 basis points in recent months.
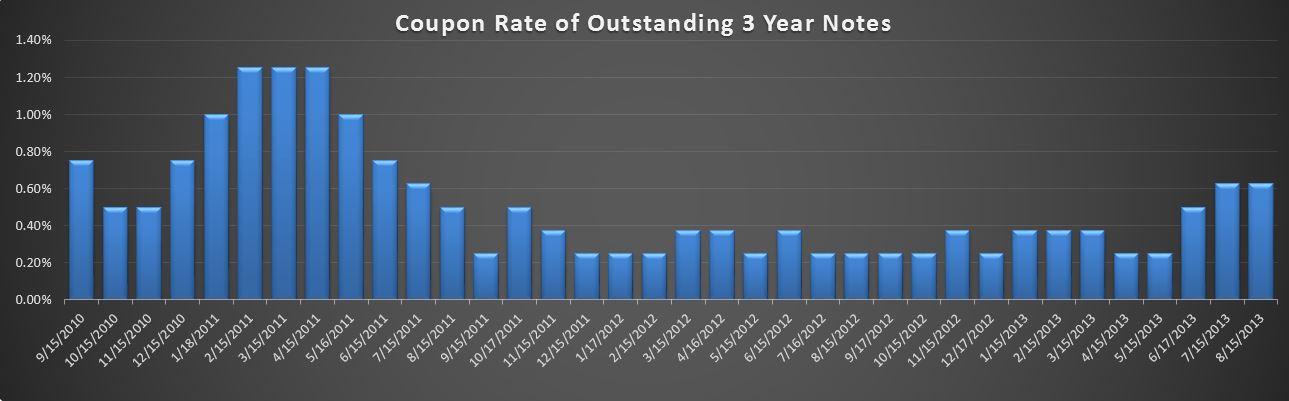
Finally, a look at the 3 year with $1.2T outstanding, which has been bouncing around 0.25% for a few years now, recently rising to 0.63%.
We could continue marching down the line, but the rates on everything shorter than 36 months are essentially zero….the 12 month rising from 0.11% to 0.14% is going to have a negligible effect the cash interest paid..I’ll start worrying about those when they get closer to 1% or so.
So what does it all mean? I’ve been saying for a while that when the Fed loses control of rates it will be game over for the deficit. Perhaps we’ve seen a 0.5% across the board increase in the past few months (including bills, which haven’t moved much)…have they lost control? I don’t think so…not yet anyway. Don’t get me wrong, they will lose control, and this surely is not a good sign (for them…it may be good for savers), but we’re just not there yet. They still seem to have no problem selling debt at not much higher that historic lows, even if a good chunk of that is being bought indirectly by the Fed.
So while this is definitely bad news, odds are this will be a very slow motion train wreck. With $12T of debt already locked in, much of it at rates higher than current rates, it will take years of higher rates to materially change the cash interest paid.
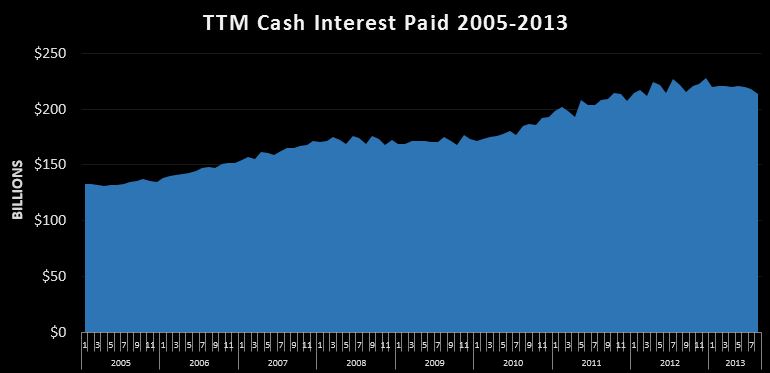
Above is a snapshot of the trailing twelve month cash interest paid. Even as the debt was skyrocketing, thanks to lower rates, the actual interest paid has increased only 61% from $133B to $214B over the same time period public debt outstanding nearly tripled from 4.4T to $12T.
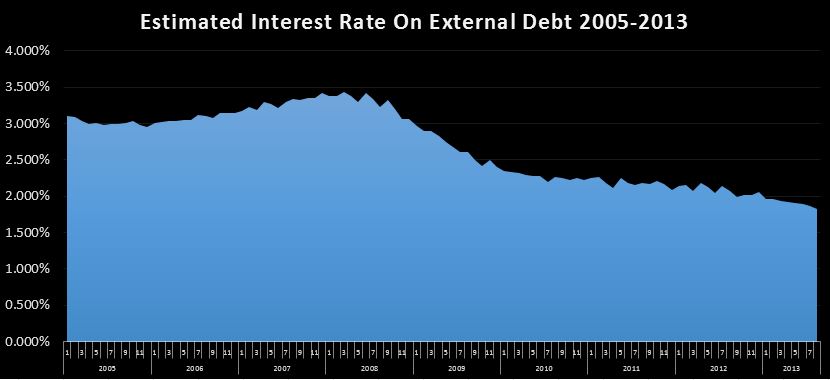
This chart shows us my estimated interest rate by dividing the TTM cash payments by the average public debt outstanding over the prior twelve months. the moderate uptick in rates has not stopped the decline in the total effective rate as older debt is being retired and rolled into lower rates, even if those rates are a bit higher than they were 3 months ago. We are currently at about 1.8%, and it took over 4 years to coast down 1% from 2.8% in April 2009.
To wrap it up, I will just say that not a lot has changed….things are as bad as they’ve been, but exceptionally low interest rates are still enabling the government to carry a massive debt load. Rates are climbing off of historic lows, but it will take another % or two rise in rates and a few years before it really starts to show up in the cash deficit. With $12T outstanding, a 1% rise in effective rates would cost an additional $120B per year in interest expense…which would be added to the deficit and grow exponentially from there. We’re not there yet, but stay tuned. If rates continue to go up, the destructive power of compound debt will be unleashed on the annual deficit, providing the final nail in the coffin, finishing up what Social Security started. In short…yes, we are still doomed.
Catch up (June/July 2018 Cash Deficit)