Category

Commentary

Catch up (June/July 2018 Cash Deficit)

By | Commentary, Daily Deficit

So…I didn’t pick a great time to go AWOL….it’s a bit premature but the deficit picture seems to be getting worse by the week since May.

recall…April was a really good month with revenues up $65B and +14% YOY…a home run by any stretch, but my question back the was…Is this the last hurrah? My theory was simple…2017’s pre tax cut taxes came due April 15th…come May we would be seeing our first “clean” view of the tax cuts.

May came in worse than expected with revenue down $35B good for a 13% decline. Outlays were up about 3%, and combined with the revenue miss, the deficit for May was $49B higher than last year. Ok…one month does not make a trend…there are all kinds of ways a single month can get thrown out of whack with prior years.

Enter June:
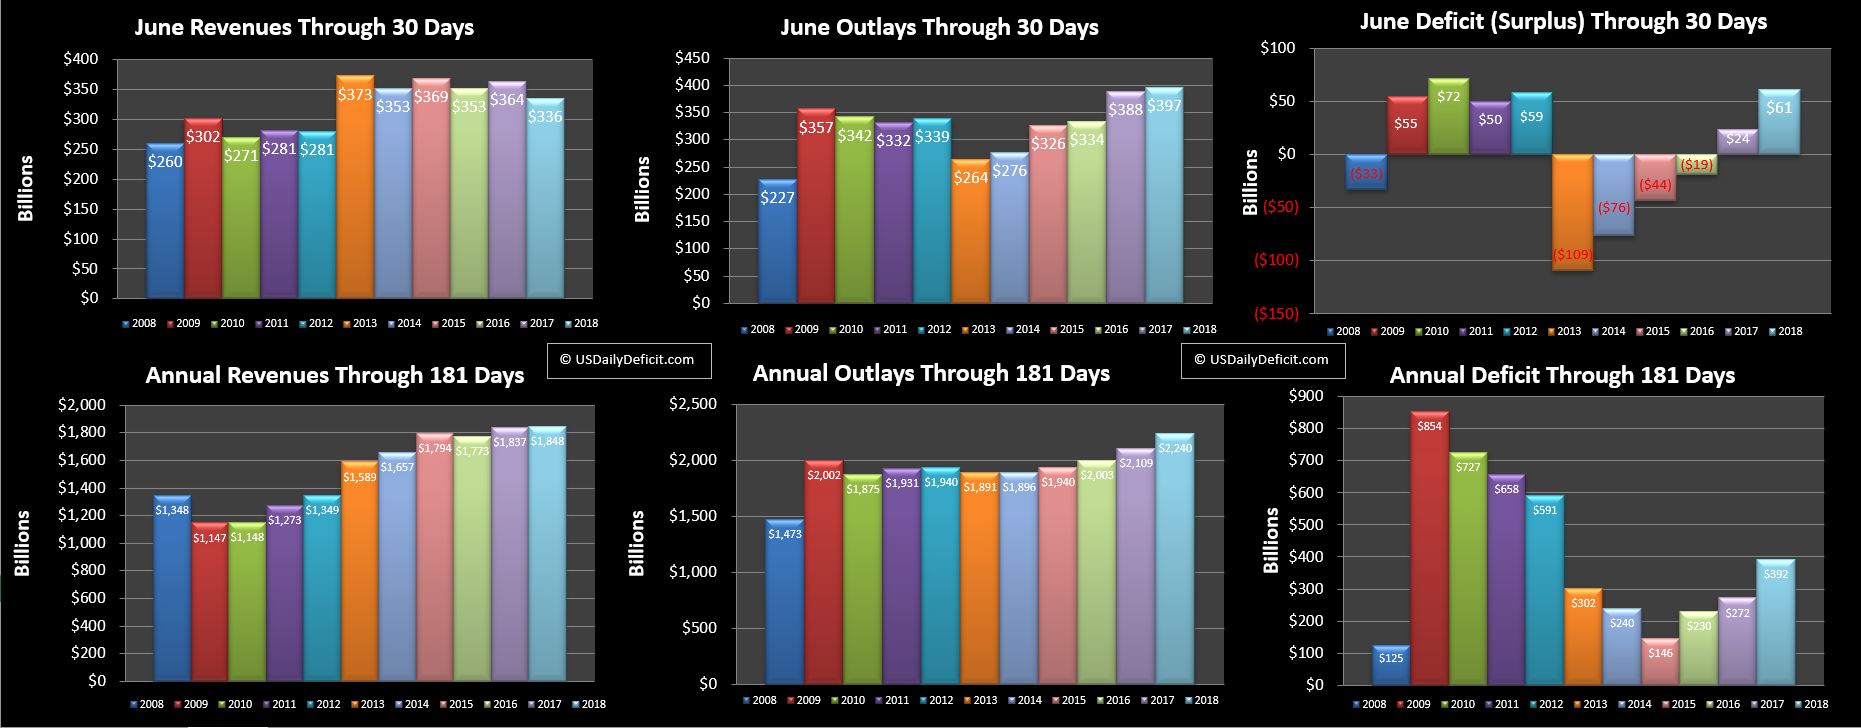
 Revenues down another $28B, an 8% decline with outlays up 2%, leading to a $64B deficit compared to last June’ s $24B.

Then July:

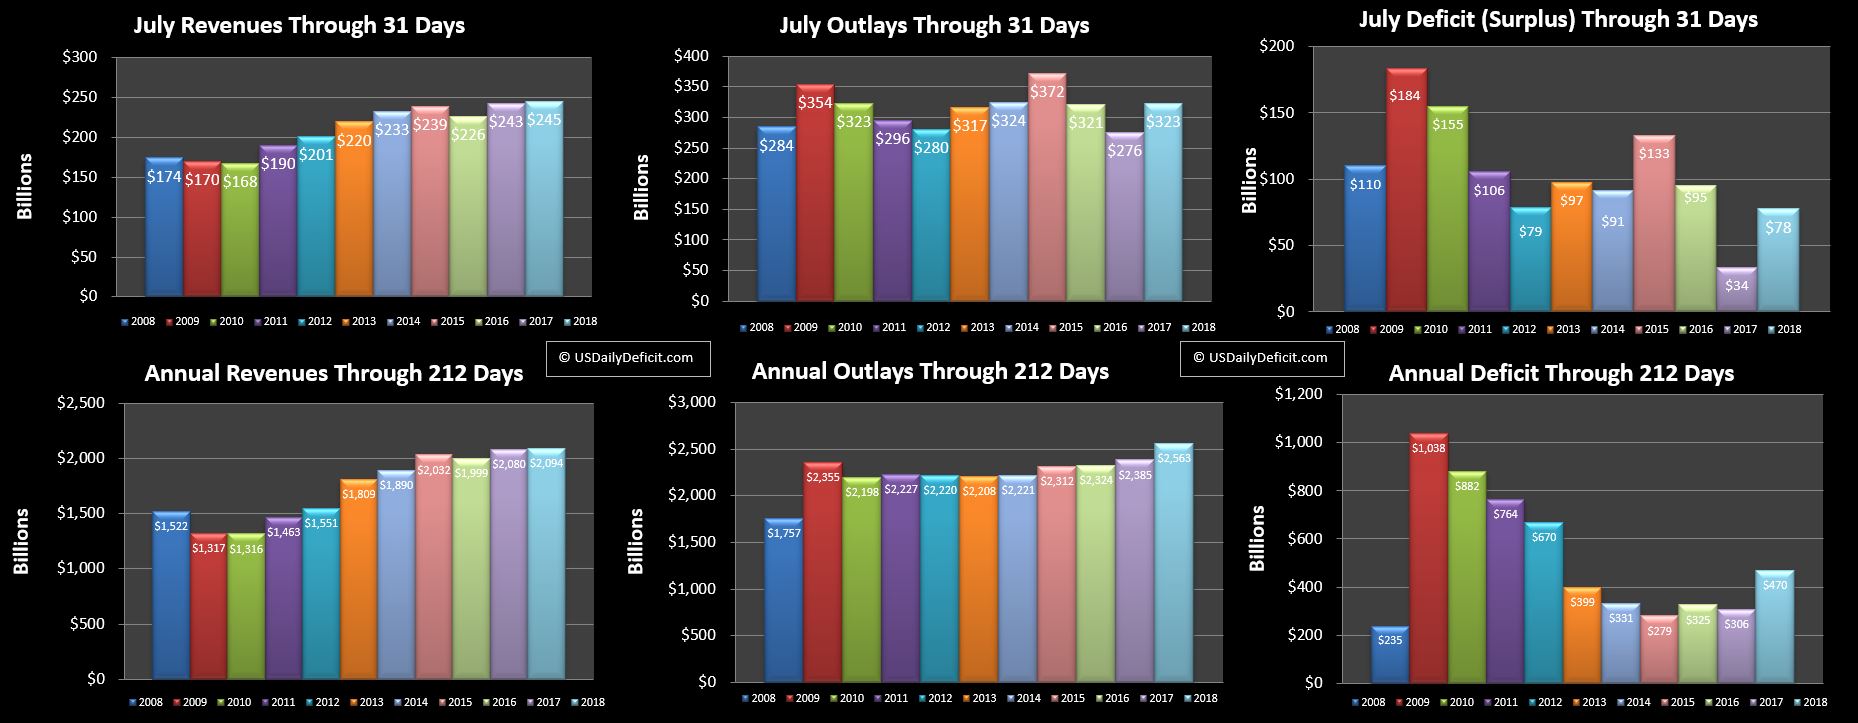
Revenues weren’t as disappointing…they were actually up $2B, but outlays were up $47B on some month end timing, putting the deficit up $44B (they don’t tie because of rounding).

So…my idea is simple…what if instead of looking at a fiscal year (Oct-Sep) or a calender year (Jan-Dec)…maybe we should instead be looking at May-April. It’s not perfect, but at least this year with tax changes…it may provide a little bit better picture of the YOY. So here goes:

Without digging in too deep… for the last three months, revenues are down 7% and outlays up 7%….and the deficit is up 80% from $166B last year to $296B.

Holy smokes!! That’s bad…maybe not as bad as it looks thanks to some timing issues in there, but it’s pretty bad. I don’t think those numbers stick for the next 9 months, but revenue down 5%, outlays up 5% sounds like a decent guess…September should provide some clarification. Now yeah, it’s kind of a one time event…all else equal next May we should see revenues get back to their ~2-3% growth, but by that time we should be well over $1T annual burn rate.

This isn’t my official forecast…but just to throw some ballpark numbers at you…Calendar 2017 ran about a $700B deficit, Calendar 2018 is looking like it will be around $900B, and 2019 could easily make a run for $1.1T. Throw in a recession anywhere any time and it’s not hard to see how we could jump to $2T virtually overnight.

Death Spiral Accelerating?

I’ve been following the deficit for about a decade and a half and blogging about it here since 2012, and a few years back it became clear to me that however slim the odds ever were….the window to avoid default had been passed and default was now inevitable….now it’s just a matter of watching for signs of a collapse.

Now timing…I have no idea…if you had asked me 10 years ago, I never would have dreamed we would make it this far…yet here we are…alive and well for the most part. In retrospect…perhaps the most critical enabler of this massive debt load was low interest rates. For close to a decade, rates were near zero, so as old debt expired, it was refinancedat super low rates….including the 30 which bottomed out at just 2.25%. Now…what kind of moron would loan Uncle Sam money for 30 years at 2.25%? Not this guy :)….but someone has it on their books.

And then…interest rates started rising. They still aren’t high….but every month now old debt is expiring and being refinanced at higher rates than a few years ago. Short term debt…once practically 0% is getting close to 2%, and longer term debt is edging past 3%. Still low historically, but when you are adding debt at $1T per year and refinancing Trillions more….each fraction of a % means just a little more debt on the camels back…day by day, month by month, year by year. We already know it is impossible to repay….now we are just looking for signs that the fuse has been lit.

Stay tuned….it’s starting to get smokey in here…
 

Lew Building Massive Cash Hoard For Next President-Costs Taxpayers $8B Per Year

By | Commentary, Debt Limit

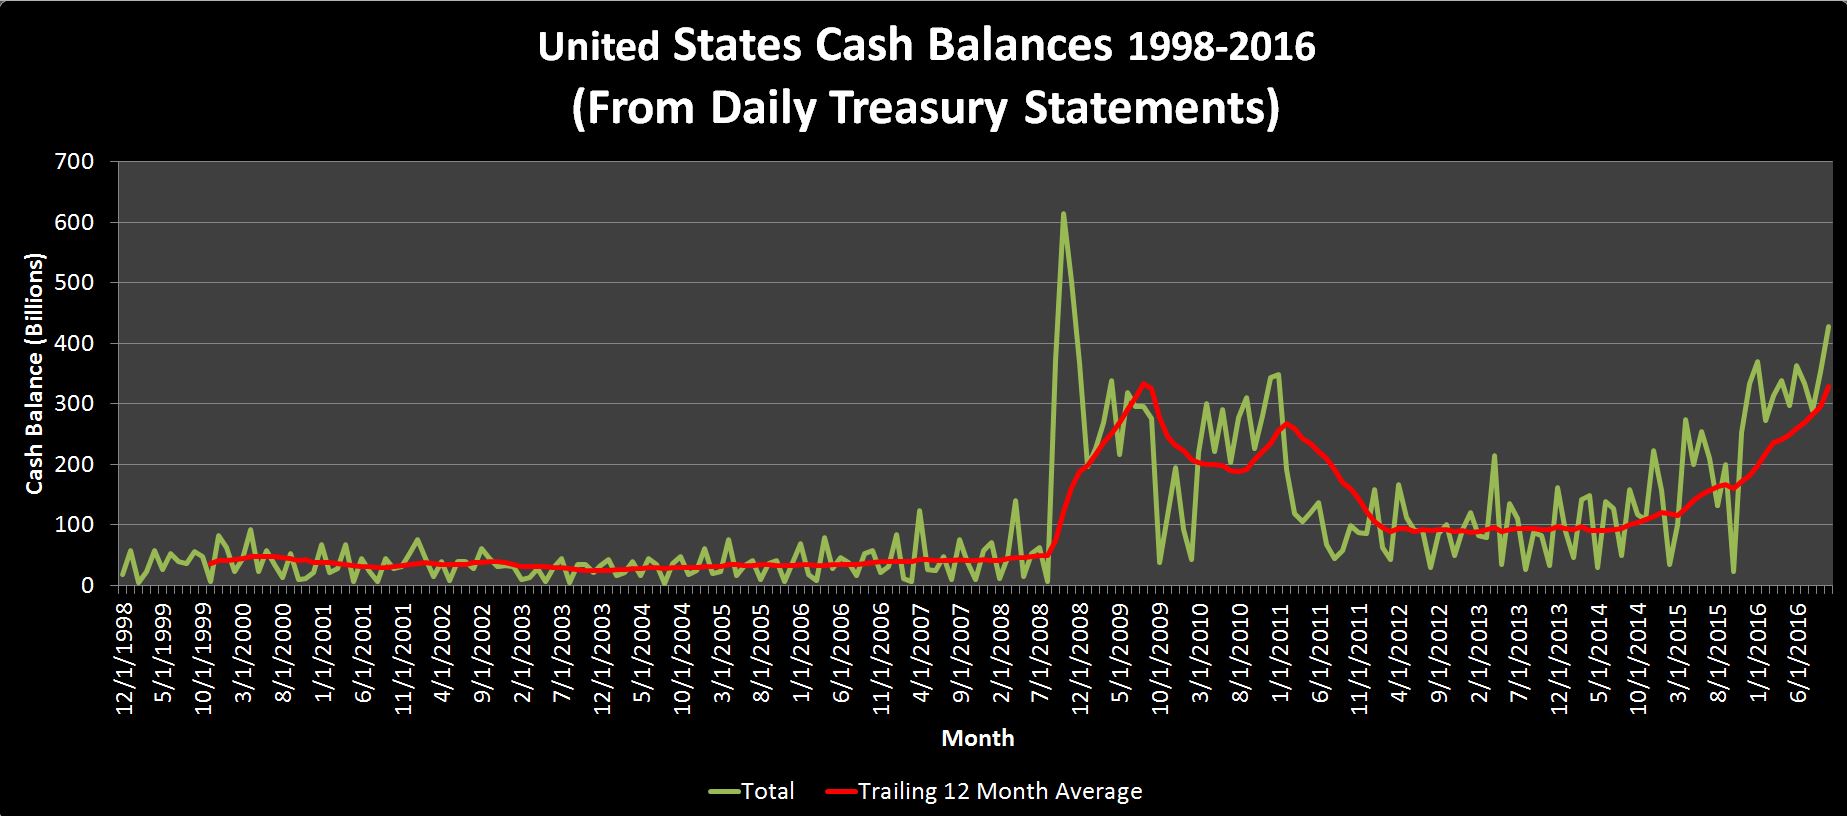
I’ve been watching this develop for a while for a while…Here’s the deal…As of last Friday, Treasury had built up a cash balance of $428B. Now, that might not sound like a lot……Hah!!…just kidding… It’s huge and enormous and completely unnecessary. To put it in perspective, Treasury could stop borrowing today, and not borrow another penny for the next 8-10 months.

Here is the historical chart:

uscashbalance For the 10 years heading up to the “Great Recession” Treasury maintained an average balance of about $36B. They used this balance, and daily cash inflows to pay for daily expenditures and issued new debt as necessary to fund the deficit. Then, in the second half of 2008, borrowing soared, ending 10/2008 with over $600B cash in the bank as they prepared to…well, we all know what they did with the cash…no need to bring that up again here 🙂 Balances were kept high for a few years before leveling off at about 100B, but have been headed back up lately.

So…who cares you may wonder? Well, think of it as a this way. Our good stewards at treasury could take say $400B of “excess” cash, and pay down the debt by that much, assuming an average rate of 2%, and save a cool $8B a year…just by not having a really stupid cash management policy. I know…I know…chump change right?

Debt Limit Avoidance?

This is the most likely answer. After the last debt limit battle ended last November, the debt limit was suspended until 3/15/2017…meaning that they could issue as much debt as they wanted in the meantime. Now I haven’t waded through the specifics of the law, but my thought all along has been…ok…If I were in charge, and I didn’t want to deal with that nonsense again, on 3/14/2017, I would just issue maybe $3-$4T of debt, park the cash in my Federal Reserve bank account, and use that to squeak by the next 4 years.  Clearly they don’t think they can pull that off without consequences, but they do seem intent to make sure the next president (I am guessing they are pulling for Clinton) hits the ground running. Back of the envelope, if we hit the debt limit 3/15/2017 with $400B of cash in the bank, the government will likely be able to go a full year without raising the debt limit just by burning down the cash balance and re-deploying “Extraordinary Measures”

I’ll just leave it at that for now….I’ll leave the conspiracy theories to the experts!!


2015 Debt Limit Day After…. Debt Outstanding Increases $339B

By | Commentary

So the numbers are in  and Treasury has officially brought all of the last 8 months of “Extraordinary Measures” IOU’s they’ve been hiding and pushed them back onto the balance sheet…

2015 End of (EM) 11-2-2015

+$339B in a single day…unfortunately not too surprising…last time around (October 2013) it was $328B. Yawn…. The new deal suspends the debt limit until 3/15/2017…so we’ll get to do this all over again in about 16 months. Booooo!!! This is getting boring….can’t they find a new stupid game to play?

Introducing My-Climate-Data.com Beta

By | Commentary

I’d like to take a minute to introduce another project of mine I’ve been working on for about a year now My-Climate-Data.com. About a year ago, a simple question popped into my mind….how is my  climate changing in Houston Texas? After an extensive search turned up absolutely nothing, I stumbled across the NOAA site here, where mountains of data are available for anyone with time to wait in a near infinite queue, or the patience to figure out how to convert thousands of tar.gz files to text and consolidate them into a useful database. It was a maddeningly complex process, but here I am a year later with the preliminary results….a functioning web site where you can find a site close to you, and with a few clicks be viewing the observed climate data in a pretty excel chart. At this point, I have temperature data for about 26,000 global sites loaded up and ready to go.

I encourage you to check it out, provide feedback, and tell everyone you know about it. This is just the beginning…I am currently working on adding precipitation, and about a dozen other metrics into the file to give you a complete picture of the climate history of over 80,000 global sites.

Screenshot below….do follow the instructions. It takes a while to load the Google Map with all of the sites….hopefully the redesign I am working on will improve this.:

MCD_HOME_SCREENSHOT

May 2015 Cash Deficit

By | Commentary, Daily Deficit

The US Daily Cash Surplus for Friday 5/29/2015 was $2.4B bringing the May 2015 Cash Deficit to $104B for the month.

2015-05-29 USDD


Revenues:

Revenues were up nearly $10B good for a 4.5% YOY improvement. May 2015 had one less business day, so adding that in and we would have been between 6-7%…not as impressive as April’s +13.5%, but good enough.

Outlays:

Outlays were down $31B, but all of that is related to timing as in 2014 $30-40B of payments due 6/1 went out in May since 6/1 fell on a weekend. May’s gain will be June’s pain, expect it to start with a big hole

Deficit: On increased revenues and decreased outlays, the deficit was down $40B vs May 2014. Pulling out timing events, I’d guess we were more or less flat

YTD: We are now 5 months in, and revenue is up 9%. Outlays show flat, but adjusted for timing I’d put them at +3%. That leaves us with the deficit itself with a $103B YOY improvement.

June Outlook: My initial May deficit forecast was $100B, not far off from the $104B actual. June is a quarter close month, which means it should have fairly strong tax revenues. Last June posted a $78B surplus, but due to the timing discussed above, I am putting my initial June 2015 forecast at a $50B surplus. In this number is 8% YOY baseline revenue increase based on what we saw in May, plus an extra business day in 2015 over 2014. Offsetting that, I expect Fannie/Freddie dividends to continue their plunge, maybe coming in at $2-3B vs $10B a year ago. Outlays will be up big….including a 3% baseline plus normalized timing picking up in June the outlays that went out in late May in 2014.

D-Day:  We ended the month of May with $199B of cash, down from $275B to end April. I’d guess they also burned through another $30B of “Extrordinary Measures” (EM), bringing the total to $130B since they started in March out of an estimated $350B at their disposal. Last month I estimated the cash available for deficit spending was at $525B…as of the end of May I would lower that to $199B cash+$220B EM, so $419B. This puts default day in mid February-2016…unless of course the debt limit is raised, which we all know it will be.