July 2013 Deficit Review

By 08/05/2013Commentary
The July 2013 deficit at $90B, was $8B higher than last July’s $82B deficit. It’s not a huge miss, but a deep dive into the details will tell a little bit different story.
Revenues:
Net cash revenues came in at $220B compared to $201B last year for a 9% YOY growth. Without a doubt, it’s a good number, but it is a material step down from the 15%+ we averaged over the Jan-April period. The chart below shows the YOY revenues for a selection of the larger cash revenue categories.

08-04-2013 July Revenues

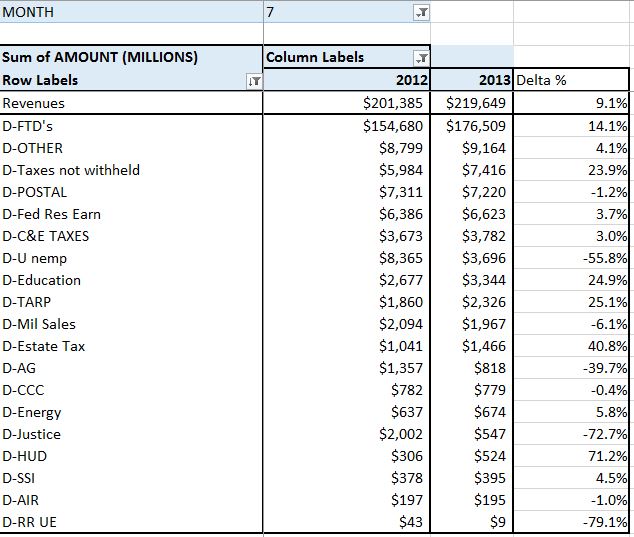
The top line has total cash revenues. Most of the story can be seen in the next line…Federal Tax Deposits (FTD’s). Up $22B, 14%. It was aided by an extra day, but no matter how you look at it, this is a good solid number. Taxes not withheld were also up…this time 24%, but this is a slow month, and that only netted $1.5B. The only other material change worth noting was the 56% reduction ($4.7B) in unemployment deposits from the states. Believe it or not, this program is kinda sorta actually run like an insurance program, so I can only guess that perhaps premiums have decreased as we ease ourselves away from the Great Recession?? In any case, this category is usually good for $50-60B per year of cash revenues that I had projected to grow at 5%…I may need to revisit that assumption. But bottom line on revenues…up by a healthy amount, just not as much as before. It wouldn’t shock me one bit if we saw this ~10% growth continue through the rest of the year…It’s what comes in January 2014 that we should be concerned about.
Outlays:
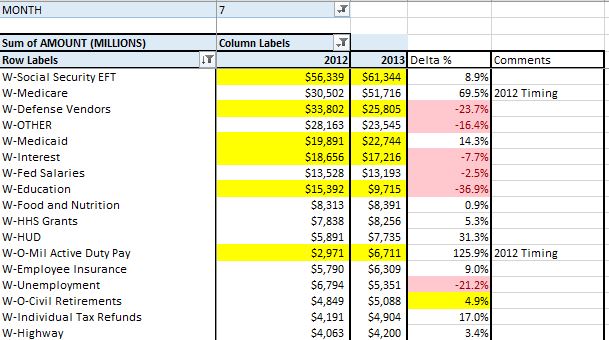
Cash Outlays were up $27B YOY from last year’s $283B to $310B in July 2013. However….last July was about $35B light due to payments due 7/1 going out early because of the weekend. If we adjust for this, we actually see an $8B overall reduction.

08-04-2013 July Outlays

Of note in July, we see Social Security’s constant and scary growth….8.9%….$62B per year annualized  and accelerating. Nearly all of the reductions appear to come from Defense Vendors and Education…but it is interesting that we continue to see small reductions in cash interest expense…no surprise as discussed in detail here. Basically, even though rates have come up a bit from extraordinary lows, the debt coming due is being rolled at lower rates than it was issued, bringing the weighted average rates down enough to lower the total interest paid, even with $800B of additional debt.
DEBT:
External debt was up a mere $16B from June, from $11.901T to $11.917T as the debt limit continues to suppress “reported” debt. YOY, debt was up $800B from $11.1T to $11.9T, pretty much in line with the TTM deficit. Now…it is important to note that “extraordinary measures”(EM) used to circumvent the debt limit do not affect the cash deficit, which as far as I can tell remains correctly reported. Instead… EM essentially lets the government park debt off balance sheet unreported…while still issuing new debt (for cash). It’s hard to tell exactly how much has been hidden over the last few months, but I’d guess it is between $50-$100B….wild ass guess.
Summary:
While the headline number was disappointing, adjusted for timing, outlays were down and revenues were up….what more could you ask for? Outlays should continue to run a little under  last year at least through September…after that…who knows?? It really depends on what kind of deal the Republicans and Democrats hammer out. Higher outlays would seem like the safe bet, but anything could happen. Revenues will likely stay around +10% or so for the rest of the year. 2014….I’m not so sure. CBO is projecting another 2 years of +10% revenue gains, but just I don’t see how we get there. So…let’s just enjoy this deficit “improvement” while it lasts.

copernicus

Author copernicus

More posts by copernicus