For one untrained in the art of Deception Accounting, it would be easy to conclde that the deficit is a pretty straightforward concept…Revenue – Outlays = Surplus/(Deficit)…right? I thought so too for a while….taking the government’s reported Deficit # from the Monthly Treasury Statement (MTS) at face value. I even took the time to tie it out as I was gathering the data before I ever went live with this blog….comparing FY 2011 and FY2012 and finding only a $7B and $3B difference…good enough for government work right??
As it turns out…no. Over the last year, I have determined that those two data points are actually an anomaly, and that the reported deficit is quite different from a handful of other deficit calculation methodologies…including the methodology I use here when calculating the daily “cash” deficit. For example…per the MTS…the deficit over the last 12 months…May-2013-April-2014 was $500.097B. Compare that to the USDD methodology…at $569,646…nearly $70B higher.
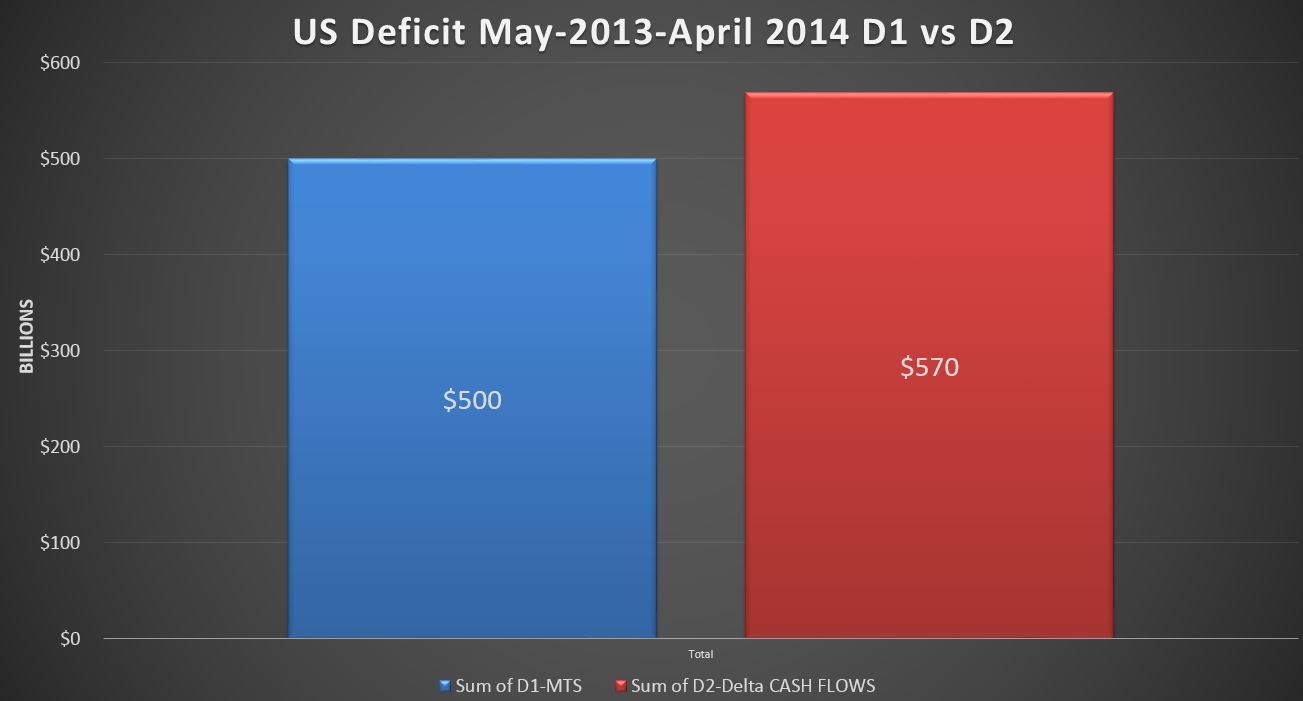
Basically….what this chart is saying is that the government is telling you the deficit over the past 12 months is $500B….and I’m telling you that it’s at least $570B. Is this a problem, and which number should we believe? To delve into that, let’s take a step back and first define four different ways one might go about calculating the deficit.
D1-MTS:
D1 takes the numbers straight from the MTS…this is the official deficit number. How it is calculated is anyone’s guess…my guess is that it’s loosely based on cash, but also includes accruals, and has cherry picked segments of government completely carved out. One large example of this would be the US post office, which operates under the farce that it is somehow a separate organization…and therefore USPS losses( and profits) are excluded from the deficit.
D2-Cash Flows:
This is the primary methodology I use to calculate the deficit based on the Daily Treasury Statement Cash Inflows and Outflows. It’s fairly straight foreward….in a given day, if cash deposits are $10B, and cash withdrawals are $15B…you have a $5B deficit. If your beginning cash balance was $50B….you would end the day with $45B.
Of course, it is never that simple, with the main complication that debt is continuously being issued and repaid…every single day, ranging from hundreds of millions to hundreds of billions on any given day. Fortunately….these are broken out on the DTS, and so we simply subtract them out conceding that issuance and repayment of debt do not contribute to the deficit directly. For example…going back to our simple example…say we also issued $100B of new debt and repaid $50B. Rather than ending the day with $45B cash…we would end up with $95B…but our deficit would be the same…$5B.
Finally, I pull out tax refunds…subtracting them both from revenues and outlays. The net effect of this on the deficit is zero, but I feel this is a more accurate accounting treatment…not making this adjustment would overstate revenue and outlays by about $350B per year.
Now…there is one flaw in this approach that I am aware of, and it relates primarily to debt issued at a discount. For example, just say we issue a $100 6 month T-Bill for $99…and pay it in full 6 months later for $100. In reality, what has happened is that we have is a $99 loan and $1 of interest. Unfortunately, this is not how the transaction is accounted for on the DTS…where the $100 out is all lumped into debt repayment…and therefore the $1 of interest is permanently excluded from the deficit in the D2-calc. In the big scheme of things, it’s not huge…$30-$50B understatement of the deficit annually, but it is a problem.
D3-Delta Cash Delta External Debt: (Key word…external debt only…D3 does not include the $5T of Intragovenmental Debt).
This is a very simple approach that in theory probably yields the most accurate deficit number available…in theory at least. Basically…I can ignore everything else and just observe the change in debt and cash between two periods to calculate the deficit/surplus over that period. Say I begin the period with $100B of cash and $10T of debt. If I end the period with the same cash and debt, my deficit….regardless of all the noise in the middle…was zero. We know this because mathematically….a deficit/surplus can only manifest itself in one of these places. So if we end the period with $10.2T of debt, and $150B of cash…we could calculate that we had a $150B deficit over the period.
There is one caveat however….this methodology breaks down during periods when the Treasury department uses “extraordinary measures” (EM) because essentially they just start pretending that they don’t owe money on some things….thus understating debt and completely nuking this calculation. We saw this back in October when the debt outstanding jumped $328B the day after the debt limit was raised (removed actually). So basically, any period that starts or stops within EM…D3 will be useless for calculating the deficit. However…once EM is stopped…all of the debt is brought back on the balance sheet and everything ties back out. So looking back to last summer, we had EM in effect between May and October….so D3 between say June and September would be screwed up…but I could look at April-November and get the right number.
In any case…I started this blog back in November 2012…right on the cusp of EM that started in December, and I had data from the prior period of EM from the summer of 2011. So while I hadn’t yet defined D3…I was aware that it would not work for what I was trying to accomplish….which is why I developed D2 and chose it as my primary metric….though admittedly I was not aware of the weakness discussed above.
D4-Delta Cash Delta All Debt: This is pretty much the same as D3, but it expands and includes the full balance of Federal Debt. As discussed here, I’m not convinced this is a valid method since I don’t believe the $5T of intragovenmental holdings are real debt…rather they represent a cumulative accounting of funds already stolen/misused. Furthermore…I fundamentally believe that SS…whose “trust fund” represents more than half of that $5T balance is nothing more than a cover for a broad based ~15% income tax….disguised as a pension plan that is really a gigantic welfare scheme…as discussed in detail here.
So…I present D4 primarily as a reference point only, though I don’t completely dismiss its relevance.
And now, with D1-D4 defined, let’s line them all up…I chose the twelve month period of April-2013-March-2014 because it avoids last summer’s EM issues for D3 and D4 as noted above.
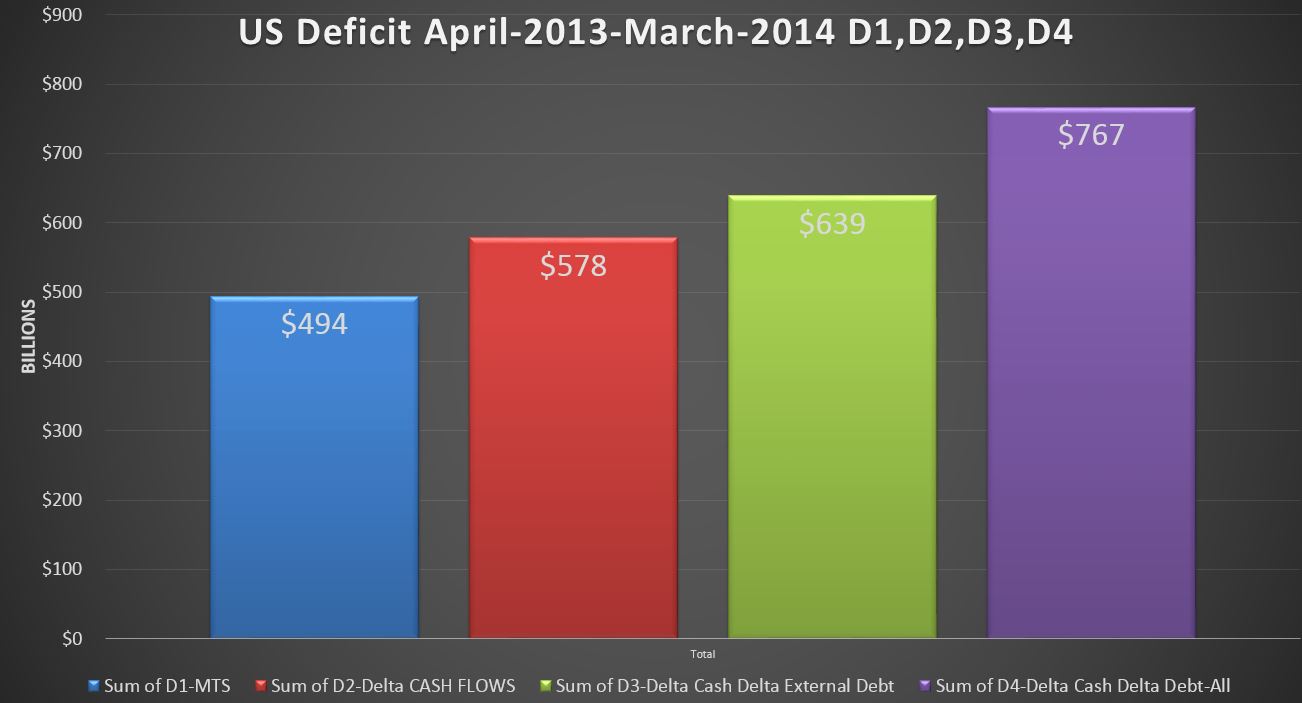
So we have the official MTS deficit number at $494B…$145B lower than what I would call the best number..D3 at $639. Just for fun…let’s pencil that one out by pulling up the final DTS from March 2013 and March 2014. We see that over this 12 month period cash increased from $79B to $142B… a $63B gain. However, Debt held by the public increased from $11.917T to $12.619T…a $702B increase. So net the “bad guy” of $702B debt gain against the $63B “good guy” cash build….and we get a D3 deficit of $639B. You probably want to know what makes up the $145B delta…..that’s a damn good question…and one that I can’t answer. It has to be far more than just the post office being excluded…that was supposedly only $5B for FY 2013. But just because I can’t think of a good explanation doesn’t mean one doesn’t exist….any ideas from my readers?
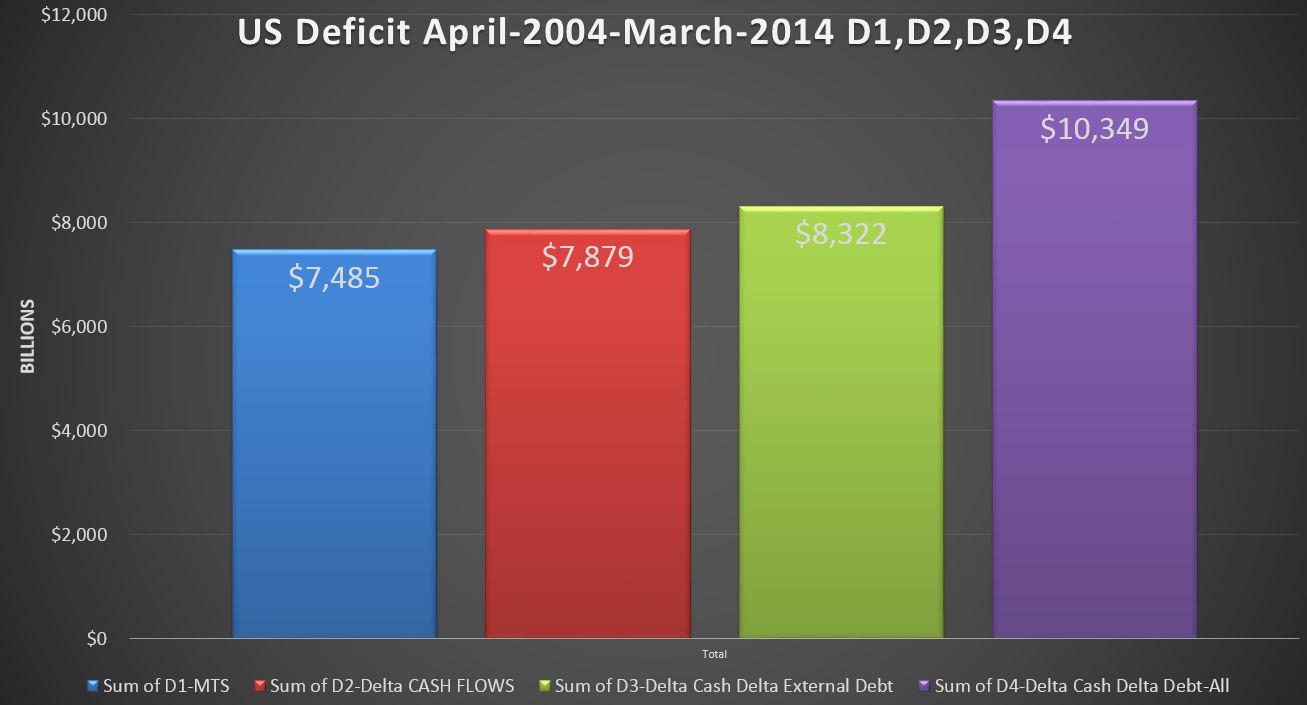
Above we take a final look…this time over the 10 year period from 4/2004 to 3/2014. Over that period, we see an $837B delta between the official deficit number and D3 ($2.9T if you believe in D4).
The question I asked at the beginning was
“Is this a problem, and which number should we believe?”
As I detailed above…D3 is the number I put the most faith in….cash and debt outstanding are separately verifiable and just about the last thing any organization is going to misstate…or worse lie about. I’m not saying they wouldn’t….just that they would probably lie about a lot of other things first….before resorting to lying about debt and cash, which are generally the easiest items for an auditor to verify. The MTS on the other hand….I’m not so sure. Give an organization some clever accountants and the power to define their own accounting policies and a standards and at the end of the day you will probably have some pretty useless financial statements….and that goes for corporate America too…not just Uncle Sam.
As for whether or not this is a problem…..my first thought was yes…. depending on what makes up that $837B 10 year delta between D1 and D3. If it is a systematic and pervasive intentional understatement of the United States deficit to the tune of nearly $1T…then I’d say yeah…it’s a problem…though at $1T…perhaps it’s barely material when bumped up against the big picture. It’s not so much the $ that are of concern…it would be the credibility of the government at stake….
But on second thought….since they don’t have any of that (credibility)….maybe it’s all just a big nothing either way….curious perhaps, but not as interesting as Dancing With The Stars Season 19???