Tag

US debt

Congressional Budget Office vs. Citizens Budget Office

By | Commentary

CBO vs. CBO Round 1

As required by law, the Congressional Budget Office released their semi-annual 10 year budget forecast last month, projecting a $6.825T deficit between FY 2013 and 2022. Over that period, debt held by the public (excluding Intragovernmental debt) is projected to increase $7.6T from $11.3T to $18.9T to end FY 2012. On its face, that sounds pretty terrible, though it is a marginal improvement over the last 10 year period where debt increased $7.7T from $3.6T at the end of FY 2002 to $11.3 at the end of FY 2012 according to the US Treasuries Debt To The Penny web site.
That the CBO has a spotty record is no secret, including their famous projection in 2000 that the debt would be eliminated by 2010, missing that one by about $7.5T. To be fair, it’s not all the CBO’s fault. Their masters in congress dictate that they use predetermined assumptions…regardless of how unlikely those assumptions are. In any case, while this forecast is definitely an improvement over the August-2012 release which forecasted a mere $2.3T deficit between 2013 and 2022, it still struck me as wildly optimistic, particularly on the revenue side, where they have revenues increasing 93% from 2012 to 2022, despite the last 10 year period only increasing 46% from 2002 to 2012.
All of this got me to thinking…could I, a simple citizen-accountant with a small deficit blog, do a better job forecasting the 10 year deficit than the mighty CBO, with their legions of TPS processing bureaucrats? We won’t know for 10 years, but below is my personal Budget Outlook for 2013-2012.

Methodology:

My preferred source of historical data is the Daily Treasury Statement (DTS) which provides a daily snapshot of cash inflows and outflows, uncorrupted by the so called “principles” of government accounting. From the DTS, I have identified 19 cash revenue streams and 35 categories of cash outlays. For each, I have created an interactive forecast of the next 10 years by month, taking into account seasonal patterns and historical rates of growth. One key assumption is that interest paid on public debt stays around 2%. For more on methodology see related posts on my blog USDailyDeficit.com here

Revenues:

2013-03-28 CBO vs CBO Revenue 
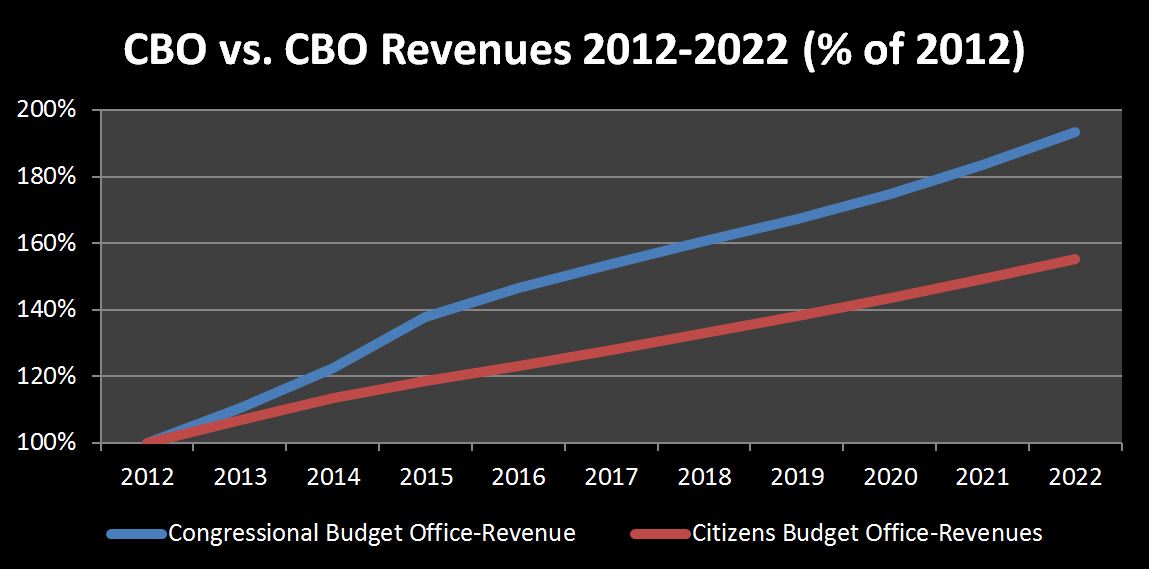
This chart gives us 2013-2022 projected revenues as a percentage of 2012 actuals. The Congressional Budget Office projects revenues to grow at 11%-12% per year from 2013 to 2015, before tapering down to a 4%-6% for the rest of the forecast period. I think this is quite optimistic, especially for 2015. 2013 does get a one-time bump due to actual tax hikes on income and payroll. However, I have a hard time seeing this repeat for 2014 and 2015 without significant additional tax hikes in the $200B per year range, or $2T for those who prefer their tax hikes presented in decades rather than annualized. At this time, that just doesn’t seem realistic to me at all. Over the forecast period, the Congressional Budget Office forecasts revenues to increase 93% from $2.449T in 2012 to $4.734T in 2022. My forecast comes in at 55% growth over the same period. For reference, over the prior 10 year period, 2002 to 2012, revenues increased by 46%.

Outlays:

2013-03-28 CBO vs CBO Outlays

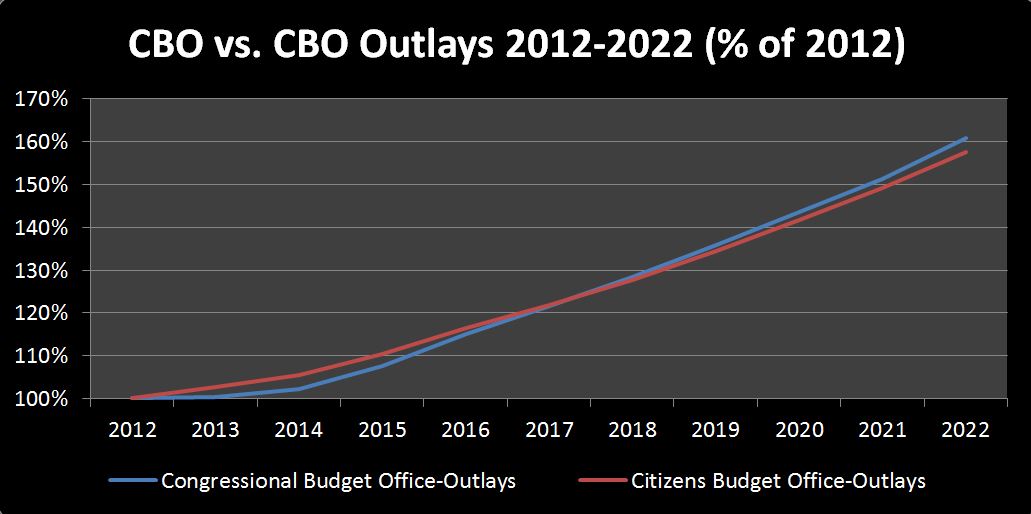
The Outlays chart is presented again with 2012 as a base and the forecast years as a percentage of the base. While the forecasts look surprisingly similar, the internals reveal some big differences. The key difference is the expected interest rate. I keep interest rates constant at 2% over the forecast period, while the CBO keeps rates at 2% through 2015, before gradually increasing to 4.2% by 2022. The result is that while I forecast public debt at the end of 2022 a full $5T higher than the CBO, they have 2022 interest expense at $795B vs. my forecast $452B. On the other hand, for the remaing outlay categories, I am projecting a growth rate that exceeds the CBO’s forecast, coincidentally just about completely offsetting the lower interest expense I am forecasting.

Deficit:

2013-03-28 CBO vs CBO Deficit

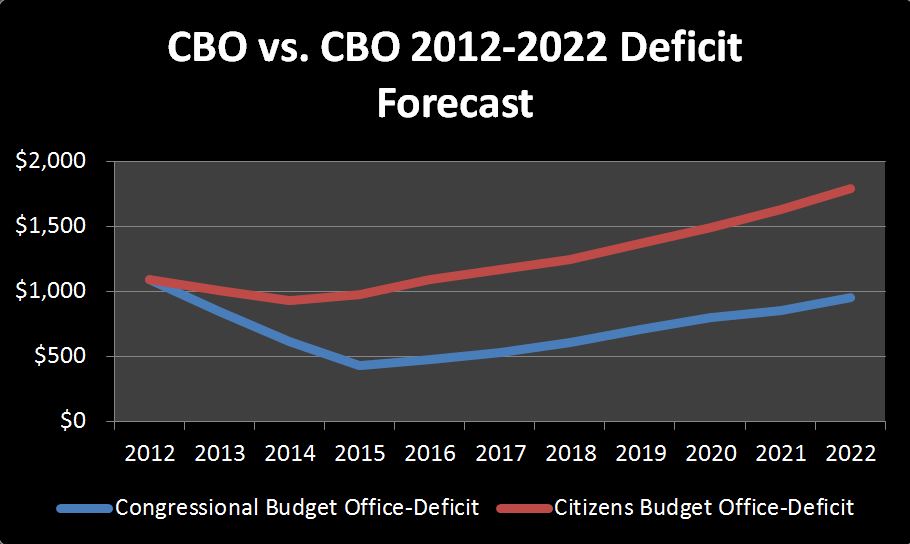
 Once you have revenues and outlays forecast, the rest is pretty simple math. The CBO has the deficit decreasing from $1.089T in 2012 down to a low of $430B in 2015 before picking back up as the pace of outlays increases faster than revenues, ending 2022 back neat $1T. Over the 10 year period, the total deficit forecasted is $6.825T. My forecast shows slight deficit improvements in 2013 and 2014 before swinging back in 2015 and accelerating to $1.788T by 2022, for a 10 year deficit of $12.7T, $5.875T worse than the CBO’s forecast.

Debt:

2013-03-28 CBO vs CBO Debt

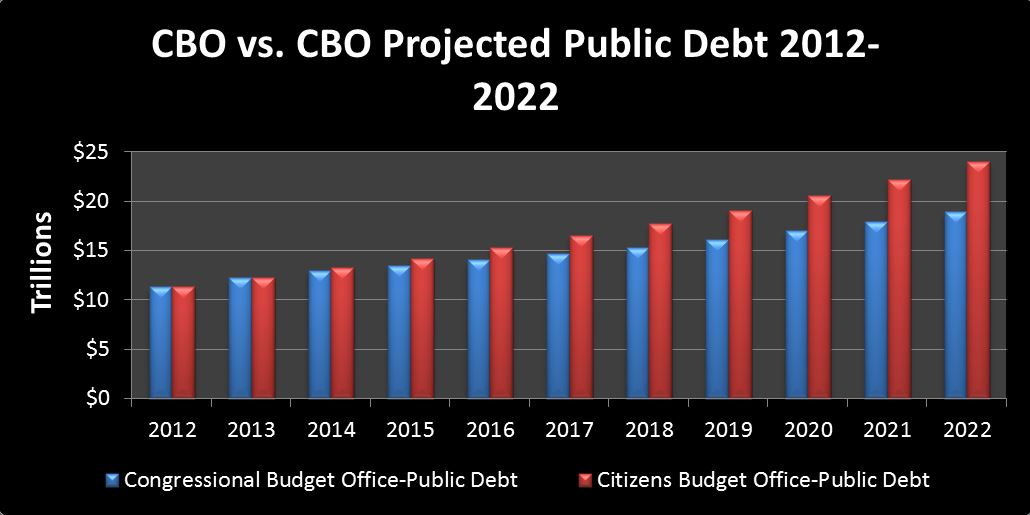
Since we come to very different conclusions on the 10 year deficit, it should be no surprise that we also come to different conclusions about debt outstanding. While the CBO forecasts public debt outstanding to be $18.902T, I forecast it will be $23.972, a more than $5T difference. For me, this is where the rubber meets the road. Even today, US treasuries are seen as the gold standard of bonds, being priced as if they were nearly risk free. As an investor,I think you have to ask yourself “For how long?” When does the market start to question the ability of the US to repay her debts? Is it when we hit $20T in May of 2020? Five years later in October of 2025 when we smash through$30T?  Or is it sooner, perhaps this summer when the debt limit battle resumes after a brief hiatus? If we happen to make it to 2022, whether our debt is at $19T or $24T, the reality is, it only gets worse from there.  Even if you missed Greece, Italy, Spain and Cyprus, for the US, the writing is on the wall.

Conclusions:

Congress is stuck between the proverbial rock and hard place. In The Spending Problem I compared 2007, the last year we came close to running a surplus, to 2011, when we ran a $1.3T deficit. Over that period, while population increased about 5% and revenues were nearly flat, outlays increased 36%. This created a new and unsustainable baseline that we will never “grow” our way out of. It is quite clear that spending is the problem and that cutting spending is the solution. However, those trillion dollar deficits, going on five straight years, are literally the only thing keeping GDP positive and “official” unemployment in the single digits. Pulling $1T of government spending out of the economy now, or ever, is almost guaranteed to reduce GDP by more than $1T, maybe by a lot more. So, politicians have two choices.
1)      Fix it now. Cut spending by around $1T per year to get it back in line with the pre-2007 baseline. This will pre-empt the impending debt crisis, however,it would immidiately tank the economy, putting countless people out of work, infuriate huge voting blocks, and it only gets worse from there. With some really good luck, in five years or so, the economy recalibrates itself, finds a new equalibrium, and we all go on our merry way, though this is in no way a sure thing.
2)      The second option is to stay on the current path, borrowing more and more each year just to keep GDP in place. Public debt outstanding surpasses $15T, 20T, 25T. Nobody knows where, but somewhere along the line, the house of cards simply falls apart. When that happens, and it will, lookout because the market is going to do a nosedive that makes 2008 feel like a pillowfight.After that, we pick up the pieces and more or less start over from scratch, hopefully.
Given that the time to really fix anything probably passed a few years ago, and recent squables have only led to inconsequential cuts and revenue increases, The likely outcome is clear. We will kick the can until it is no longer possible. In the meantime, you can be assured that I will not be loaning Uncle Sam any money.
I have one more interesting conclusion related to interest rates that should interest everyone. The Federal Reserve’s storyline for quite a few years now has been that they are keeping interest rates low to help stimulate a recovering economy, lower unemployment, encourage lending, ect. I’ve suspected this for a while, but after completing this analysis, I am convinced that all of that is just a cover story. The truth is, they have no choice to keep interest rates low because if they don’t, the federal budget would instantly come apart at its seams.

2013-03-28 CBO vs CBO Interest

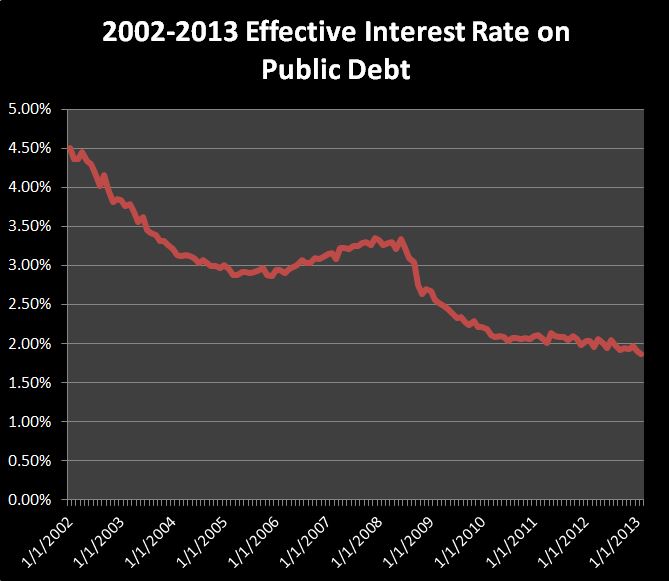
In 2012, the US paid $223B in interest on $11.28T of public debt, for an effective rate of 2%. If that doubled overnight to a very historically reasonable 4%, and we applied it to our model it would have added an additional $4.5T to the debt  in just our ten year forecast. This is due to the additional outlays, which are of course financed, which pushes up interest expense, which increases outlays, and the cycle repeats itself. Albert Einstein is rumored to have once said that compound interest was the most powerful force in the universe. This may be true for savers, but for debtors, quite the opposite is true. As the example above illustrates, the inverse is that compound debt can be one of the most destructive forces in the universe.
I have to assume that somewhere at the federal reserve is an accountant just like me, but with better data and a lot more time cranking out “real” budget forecasts that give Ben Bernanke and President Obama nightmares. If I am correct, it means that interest rates are never going to increase so long as the Federal Reserve has control of the market. They can’t do it now with $11.9T of external debt, and they surely won’t be able to do it in the summer of 2016 as we are cruising past $15T and the presidential campaigns are in full swing. Since they can’t voluntarily raise rates, I will be watching this chart as an indicator of when they start to get raised involuntarily.


3/26/2013 Daily US Cash Deficit

By | Commentary
The US Daily Cash Deficit for 3/26/2013 was $8.3B, bringing the March deficit through 26 days to $85B. With 3 business days remaining, it looks like we are zeroing in on $105B or so, with the possibility of a $+15B surprise depending on how Medicare costs flow in.

2013-03-26 USDD

3/25/2013 Daily US Cash Deficit

By | Daily Deficit
The US Daily Cash Surplus for 3/25/2013 was $4.6B, dropping the March 2013 deficit through 25 days to $76B versus $82B for a year ago, giving 2012 it’s first lead in a while. It won’t last for long, but we should enter the last business day of the month neck and neck around $100B. Then, 2012, which posted a $34B deficit on 3/30/2012 should rocket past 2013, leaving us with a respectable YOY deficit improvement, at least on paper.
One final note on refunds. 3/2013 refunds are running about $10B over 3/2012, but have been more or less flat for several weeks now. Through almost 3 months, 2013 refunds are $15B under 2012, making it a distinct possibility that 2013 refunds are just going to come in under what we saw last year. A recent article at Money suggests the same, and also goes on to say that more people expect to owe money this year. If this is accurate, we could see a respectable spike in revenues on 4/15/2013…stay tuned!! That would be good news…well kinda…unless you are paying them.

2013-03-25 USDD

How Paul Krugman and the Economic Witch Doctors accumulated $16.7 Trillion of Debt

By | Commentary, Quantum Economics
This is kind of long, and a bit of a diversion…but I hope you enjoy:
The first thing you learn in accounting school…after you find your stapler that is.. Is that there are two sides to every entry…a debit, and a credit. If you are still awake, let me explain…. Let’s say you go to the store and buy a new computer for $500. The accounting entry would be to debit assets…+500, credit cash -500. Or…if you put it on the plastic…the credit would be to liabilities -500. In total, the transaction itself has no net effect on the balance sheet as a whole. It’s just an even exchange of one type of asset-cash, for another type of asset…the computer. Simple stuff right…Hey you in the back…WAKEUP!!.. Seriously..I’m getting to something very important.
This concept doesn’t only apply to transactions within organizations or individual’s balance sheets…it also applies to all transactions between them. For example…a cell phone bill. AT&T sends you a bill for $100. To them…this represents revenue… a credit. To you, this is an expense…a debit. Got that? It is extremely important. Every dollar of GDP….every dollar of revenue has an evil accounting twin… completely and utterly ignored by economists and politicians….cost. If you need a heart transplant…GDP +2M. Wrecked your car? +$30k. House blown down by a tornado? $+250k. Paid $75 to turbo tax because the tax laws are flippin ridiculous??+75 Had to hire an army of accountants to comply with government SOX laws that do absolutely nothing to protect investors??+$∞. Mow your own grass..+$40 wait…better make that $+0. Still think GDP measures…well anything…much less the lifeblood of the economy?
And yet…I think it would be fair to say that all modern economic theory is GDP-centric. The primary goal of all governments and economists is to Increase GDP…which they believe will solve all of our problems. This is in my opinion false…and therefore, at its core, all modern economic theory is fundamentally flawed, and all economic policies based on these theories are doomed to fail in one way or another.
Long story short…for nearly 100 years, countries and their leaders have been judged by their ability to increase GDP…never mind that GDP is a fundamentally flawed concept. And so…over the years, our leaders have learned to play the game better and better…forgetting to ask whether the spoils of the game were even worth playing for. At some point… our leaders, with the help of their trusty economic advisors found a cheat code they could use to increase GDP at their will. All they had to do was borrow (or print) money, and spend it. It didn’t really matter on what. It could be a dam, a school, a bridge to nowhere, a building full of bureaucrats, or even a new welfare program.  From there, since they get to define GDP, the process for accounting for GDP(don’t get me started), and ultimately report GDP….the rest of the puzzle just fell into place… It started taking off in the 80’s and had hit full steam by 2008, when for a moment…it looked like maybe the magic donkey was starting to choke. So we doubled down…increasing our deficits from hundreds of billions per year…to over a trillion per year…now going on 5 years in a row.
This is all a completely rational outcome. If you believe that GDP is the elixir of life…and that even a tiny drop in growth, much less an actual decrease of a few % has consequences that are so terrible they will almost certainly bring on a “greater depression”…and of course impair your re-election hopes…then you will do whatever your economic witch doctor says…even if it sounds absolutely ridiculous….like running a trillion dollar deficit for 5 years running, then pretending like there isn’t a problem.
And that brings us to today. Governments around the globe are scared as hell of a drop in GDP, and willing to do anything…ANYTHING… to make sure that it doesn’t happen on their watch. Unfortunately, modern economics is pretty much a one trick pony…just ask Nobel Prize winner Paul Krugman, probably the most famous Witch Doctor economist in the world. According to him, the problem is that we simply didn’t spend enough, and to fix it, all we have to do is spend more. In other words…well, 2 leaches didn’t work….and 15 leaches didn’t work…what the hell…let’s try 200.
I think that the time has come to throw all of the witch doctors out, and the reason lies in some relatively simple accounting. Let’s imagine a simple transaction between a buyer and a seller. Each comes to the table with very different goals in mind. Our buyer would like to be able to purchase an infinite quantity of goods…for zero price. Our seller, on the other hand, would like to sell one unit…for an infinite price…and then retire. Just for fun, let’s say that the product in mind is a 1 hour massage (ok…50 minutes). At the beginning of the negotiation, we know that there are only two possible outcomes….a transaction occurs, or it doesn’t. Let’s say they haggle and agree at a price of $75. The buyer exchanges $75, for 50 minutes of the seller’s time, and GDP increases by $75.(assuming the seller reports it) Hooray right…parades in the street…all hail GDP. But…don’t forget about the evil twin…let’s think for a second about the other outcome. After haggling for a bit, the buyer is at $25, and the seller is still at $75….no transaction occurs. Oh no…GDP is crashing…prepare the soup kitchens right? Well…no. You see, the buyer has determined that the value of a massage to him is only $25. Spending $75, would mean taking a loss….which he won’t do, because he can take his $75, and get something he personally values at greater than $75…even if that something is nothing at all. On the other side of the transaction, the seller values his time at greater than $25. He would rather call it a day and spend the extra time with his kids…or watching TV, or sleeping….all things he may personally value more than the marginal $25. In this case, a non-transaction is the optimal economic outcome…even though the economist is incapable of measuring it. In the real world….like dark matter in the universe, non-transactions make up the majority of all transactions. But even though economists can’t see them, the value is real. This is Dark GDP, which I believe is one of the economic “missing links”…more on that some other day.
Let’s go back to our non-transaction, but instead, apply some modern economic theory and see what happens. The economist sees the potential to create GDP…the seller does want to give a massage, and the buyer does actually want a massage, they are just too far apart on price. So the economist has a great idea…first, the government borrows $50. Then, they create a “massage for clunkers” program, which pays buyers $25 to get a massage and sellers $25 to give a massage. Thus…the $50 gap is bridged, and Dark GDP is converted to “Real” GDP…targets are met, and all is right with the world….except that they forgot to mention that in 10 years….the buyer and seller will each have to repay the $25+ interest…..or, and this is more likely….the government will just default on the $50 loan, leaving the lender out in the cold. Also….dark GDP has been destroyed in the process. Were proper accounting possible, the losses of forcing this transaction through would be quite apparent, but economists, I suspect, are even worse accountants than most…so they conveniently forget the moral of our story, which is that for every debit…there is a credit….even if you ignore it.
So what does all of this mean? What it means is that every $ of deficit spending overrides an optimal economic solution…the perfectly legitimate decision not to transact.  The result is higher GDP…and an economy that has been transformed from the body of an Olympian, into a sick, frail, and bedridden 500 pound man. The economist/witch doctor has achieved his singular goal….growth…which is the only vital sign he is even aware of.
It means that our quest for infinite growth  is foolish and misguided….that we need to develop different tools, other than the simple scale, to measure our  economic wellbeing. Or better yet…accept, as Einstein did, that “not everything that can be counted counts, and not everything that counts can be counted”
And now for a personal story of GDP destruction. It wasn’t so long ago, that both my wife and I were working…two college educated professionals, mid-career…you do the math….we weren’t high rollers by any stretch, but for two kids from a small town, we were doing all right. Then…we started having kids, and realized, as many people do, that some things are more important than GDP. I crunched the numbers, and shortly thereafter, my wife left her job to take on a new career on the Dark GDP side of town…as a stay at home mom. As such…our families recorded GDP was nearly cut in half…and yet, despite a statistical depression…I can assure you that all is quite fine. We have less money, but more time, and we have absolutely no regrets. Just like the massage therapist in our example….we decided that our time was more valuable than the market wages being offered, and that the optimal economic solution was simply not to transact. My family survived a massive cut in GDP, and the truth is, so will our country.
And you can be assured that GDP will shrink. GDP has become dependent upon these trillion dollar deficits and when our government stops deficit spending…either voluntarily or by force…GDP is going to shrink. Period… and probably by a lot. When the government is no longer there to pay buyers to buy and sellers to sell….the market…disfigured and mutated by decades of bad medicine…will start to gravitate to a new equilibrium that will look nothing like the current economic landscape. Entire industries and infrastructures have sprung up and been built based on the existing false assumptions. (our entire medical system for example) They will first collapse, but then rise from the ashes built anew by willing buyers and willing sellers. It will be stronger, it will be healthier, and most importantly, it will be sustainable not just for a few decades….but indefinitely, or at least until we  invite the witch doctors back in.