Tag

US Debt Limit

July 2013 Monthly Statement Of Public Debt

By | Commentary

I stumbled across this series a few months ago and have started digging into the July issue released yesterday to see if there is anything interesting. Well…interesting is probably not the right word…but I think you know what I mean.

The MSPD gives us some insight into the makeup of the public debt…giving us a summary  all of the outstanding debt…from the $40B of 1 month bills issued 7/25 at 0.02% to the $10.5B of 30 year bonds issued back in 1985 at 11.25%…a rate that is 562.5X higher than the current one month. That’s interesting right?

First…some thoughts. The treasury bills (0-12 months) are not particularly interesting at this point in time. The average rate on the $1.6T outstanding is less than 0.1%, and as discussed in a prior post….the interest paid annually on this is something like $1.5B. The rate paid could double, triple, or even grow 10X, and it would still more or less be a rounding error. So…I look at it, but until the rate gets up past 0.5% or so…it’s just not material. Why would anyone lend Uncle Sam $1.6T at effectively zero? I have no idea!!

Bonds… the 30 year securities…we don’t get a lot of movement here. They are only issued every 3 months, and none are due until 2015. The average rate on the $1.4T outstanding is around 6%, though the latest issue back on 5/15/2013 was at 2.88%. It will be interesting to see what the new August issues go for…looks like it may be over 3.5%. That’s a pretty big hike, but still well under the average of the bonds outstanding, including everything issued after 2011. Of the bonds expiring in the next 3 years, the average is about 10%…so rolling those into new bonds today would result in a reduction of annual interest expenses.(but who knows what they will be in 3 years)

Notes (2-10 years)… This is where all of the action is….we have notes expiring and being issued each and every month, and the balance…at $7.7T makes up 64% of the public debt outstanding. In July, we had $94B of notes expire. Since of course the US never actually pays off debt…they just roll it…it is interesting to see what is rolling off, and what it is being replaced with.

So… In July, we have a 2 year issued at 0.38% roll off…and we had two new 2 year issues…averaging 0.31%. √

A 3 year at 1% rolled off…and a new 3 year was issued at 0.63%. √

And… a 60 month at 3.38% rolled off…replaced by a 60 month at 1.38%…a big improvement. √

And this has been the story over the last 3 years or so. Debt outstanding is increasing at around $1T per year, but the interest rates are being driven down by Fed manipulation. So..in July 2011, the cash interest paid over the prior 12 months was $204B on 9.8T of public debt outstanding. 2 years later…the cash interest paid on 11.9T of public debt was only$218B. This could continue on for a few more years…even as rates have bounced off some extraordinary lows…they are still extremely low historically speaking.
Reply to “Has the U.S. Treasury Already Exceeded the Debt Limit?”

By | Commentary, Debt Limit
Perhaps I’m a bit jealous here….that this guy got a Drudge link and I didn’t…but I give him a swing and a miss for not paying attention. The headline refers to the Daily Treasury Statement table III, which I happen to know something about. The author notes correctly how the debt outstanding, at $16.738T is now $39B over the 16.699T official limit. Busted…right!! Well…not really. You see, there is a small subset(about $30-40B) of the debt that is exempt from the debt limit…this is not new or newsworthy, it has always been this way…not just for the past 68 days….always.
Most of this exempt debt is related to the unamortized discount…currently at $32B. So…you are probably wondering….”what the heck is the unamortized discount?” Let’s take a 3 month T-Bill for example. Rather than issuing at say $100, then paying interest plus face value three months later, they are issued at a discount, say $99, then paid in full when due. That 1$ is the discount. So…while I now have an additional $100 face value of debt on the books, your accountant will say that you technically only have $99 of debt, and will incur $1 of interest over the next 3 months. That difference…currently $32B, plus a handful of other items are specifically excluded from the debt limit calculation. Why??… I don’t know…I suppose it’s in some regulation or law somewhere, but that’s just how it is, and has always been. Pointing that out now well…it really isn’t news to anyone who has been paying attention.
Now, that’s not to say there are not shady things going on….there certainly are….Mr. DeLegge just looking under the wrong stone. The real travesty is the use of “extraordinary measures” to essentially hide debt off of the balance sheet…probably another $100B or so over the next month. Then, when the debt limit is raised, and we all know it will be…this debt will magically, and nearly instantly be parked back on the balance sheet. Ta Da!! That magic trick deserves further scrutiny….the unamortized discount….nah…that’s just good accounting (for a change). So the answer is…No…they haven’t…yet…but they fully intend to….just not as obviously as you think.
So…if you want a real debt limit primer, read Debt Limit Recap Summer 2013 written by your truly without all of the glamour associated with a Drudge Link, but guaranteed to have at least twice as much credibility 🙂

Debt Limit Recap Summer 2013

By | Commentary

It’s been 62 days since we officially hit the debt limit of $16.7B on 5/17/2013, and according to the latest I’ve been reading, Treasury does not expect this to become a problem until the September-November time frame. This is a bit confusing, so give me a second to explain what is going on here.

First…you need to know that hitting the debt limit is not the real problem….running out of cash is. If we hit the debt ceiling, but had $1T of cash in the bank, we could make it an entire year without having any problems. Obviously, we did not hit the debt limit with $1T of cash…we hit it with about $34B, but the point remains valid….we haven’t had any problems yet because we haven’t run out of cash.

Now, assuming an annual deficit of $800B, you might expect a monthly deficit of $67B…at which pace we would have run out of cash sometime in early June. Except…it’s not that simple. You see, the month to month deficit/surplus is actually all over the place, with February usually having the highest deficit at $200b+ and April typically running a strong surplus of $100B+. The rest of the months fall somewhere in between, with quarter end months generally being better on strong quarterly tax remittances.

So the time it takes for the debt limit to be a problem depends on how much cash you have in hand at that point, and the expected deficit/surplus over the coming months. The last debt limit fight…you may recall came about in January…which is the absolute worst time to have a debt limit fight because a huge amount of tax refunds are scheduled to go out starting in February. If they don’t go out…you could have a revolution on your hands, so not surprisingly, a deal was brokered, pushing the fight out to the middle of May, which as it turns out, is just about the best time to have a debt limit fight…if you must.

The main reason is that you have the strong early month outflows behind you, and with June in front of you likely to run a surplus, you have at least a few months to work it out. This June ran a $116B cash surplus….building that $34B cash stash to $135B by June 30…thanks in part to a ~$60B payday loan to Fannie Mae. Now, July and August are not deficit friendly months…I expect about $200B over this two month period. That’s more than $135B, but…thanks to the shenanigans known as “extraordinary measures”…which essentially hides real debt off the balance sheet…it seems likely that treasury can pull the difference out of its hat… September is likely another Surplus month, but small….so making it to September gets them through to early October. I don’t see how they make it much further, but you never know.

Now honestly, the date doesn’t matter….it took us 30 years to get to this point…whether we run out of cash in August or November really doesn’t matter one bit in the big picture. I fully expect the debt limit will be raised and here is why. Even with admittedly material improvement in the deficit…from $1.6T in 2009, to $600-$700B likely for calendar 2013…$700B is still a huge number. And if they don’t raise the limit…they can’t spend it. I’m not saying it’s the right thing to do, but yanking that $700B per year out of the economy is going have immediate consequences that nobody in either party is ready to deal with.

Basically, it would mean cutting everything by about 20%. Social Security, military pay, medicare, Medicaid, food stamps ect…. If you don’t cut some…like SS and military pay….you have to cut even more from the remaining programs. $700B/60k per person gives me over 10M jobs lost directly, and who knows what the secondary and tertiary effects would be. Now…one way or another, that’s going to happen anyway (and we will be better in the long run for it), but don’t expect the debt limit to be the trigger. Both Republicans and Democrats will work together to keep the imaginary party floating as long as possible before gravity takes over and we all tumble down the cliff together.

Because  of this, I am quite confident that after a lot of noise and pretend victory claimed by both sides, the debt limit will be raised. Don’t worry…Be Happy!!

7/10/2013 Daily US Cash Deficit

By | Daily Deficit

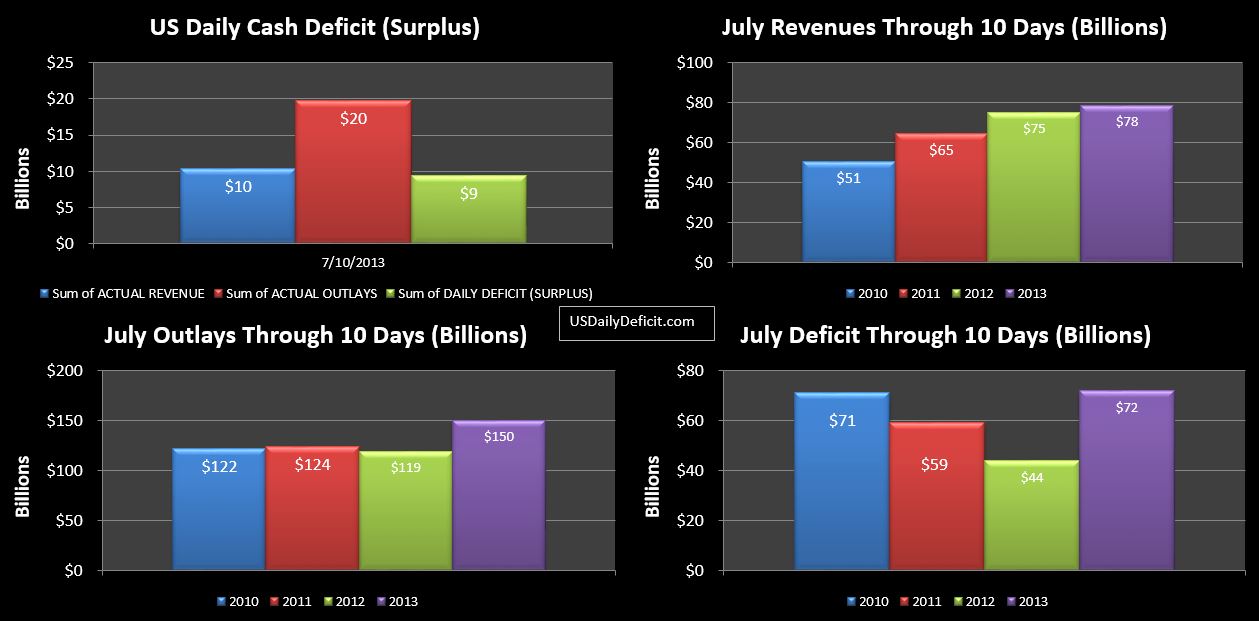
The US Daily Cash Deficit for 7/10/2013 was $9.5B pushing the June deficit through 10 days to $72B. With 1/3 of the month gone…revenues are up a meager 4%. This will be helped some by an extra day vs 7/2012…perhaps as much as a $10B (or 5%) bump, but August should give that right back. Outlays…adjusted for timing look more or less in line with last year, perhaps a few billion lower.

07-10-2013 USDD

Over at money.com Jeanne Sahadi has a front page article that is trending U.S. books $117 billion surplus in June. It’s not a terrible article, but the ignorance displayed in the comments section is a bit frightening. Everybody thinks we are saved….We aren’t. No doubt, 2013 is going to be a material improvement, but it is still going to be a $700-$800B deficit. So yeah…it’s great that we aren’t blowing through $1.6T per year anymore like we were not that long ago…. but $800B per year…with $17T accumulated…no matter how you look at it…that’s a huge hole, and we’re still digging at a ferocious pace.

07-10-2013 USDD-FC Deficit 2013-2023

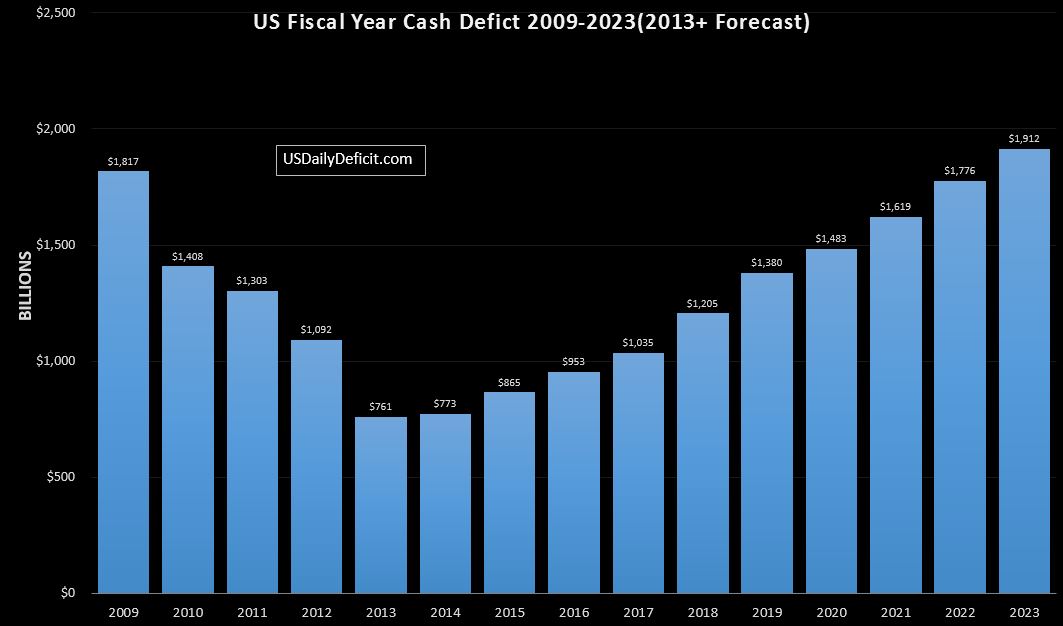
Above is the latest output from the model I use. We can see clear and steady improvement from 2009 forward as revenues picked up and cost was more or less held constant. There is no rocket science in the model. After spiking 12% or more in 2013 on tax hikes, I assume most revenues will grow at 5% in 2014 and 4% from there on…more or less in line with historical patterns. On the cost side, I assume 2% or so annual growth from 2014 on for most outlays, with a few notable exceptions. Social Security grows at 6-7%, and interest grows along with debt outstanding, but it held at about a 1.8% effective rate…extraordinarily low. For Medicare, Medicaid, and the Affordable Care Act, I use the CBO’s numbers. Using these fairly simple, and I believe realistic assumptions, I show we bottom out in 2013/2014 on increased revenues, before heading back up as spending increases on Social Security, Interest, and Healthcare outpace and run away from the modest annual revenue gains. Note…this all assumes no recesions, crashes, wars ect… although historically, it seems quite unlikely we will go another decade with out some kind of economic disturbances. I guess what I am saying is tis may end up being a conservative forecast unless the CBO is correct, and we manage to string together a few more years of 10%+ revenue gains. We all know anything is possible, but historically, it seems quite unlikely. Guess we’ll have to wait and see.

6/21/2013 Daily US Cash Deficit

By | Daily Deficit

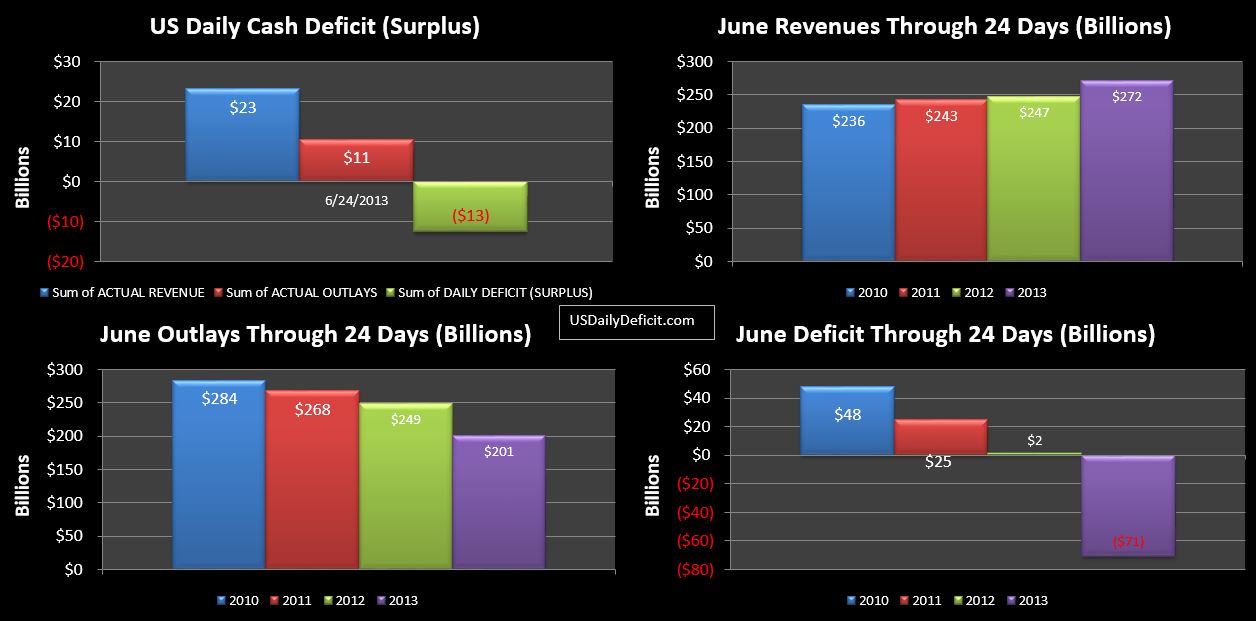
The US Daily Cash Surplus for Monday 6/24/2013 was $12.6B….again on higher than expected (by me) “tax deposits not withheld”. I’m just going to get out and own this…I jumped the gun earlier this week when it appeared like we were going to see a 20% decrease in taxes not withheld….which would be a very bearish indicator for the rest of the year and beyond. By this time in 2012…taxes not withheld had slowed to a trickle at less than $1B per day. Today…we actually see an increase…from $5B Friday to $8B. Lesson learned…patterns don’t always hold. So anyway…this is good news, and the $8B of receipts pushes the YOY to a positive 10%…with 4 days to go, we could see even bigger gains, but I’m done guessing for now:)

06-24-2013 USDD

So with four days left we have net cash Revenues up a bona fide 10%…not shabby.

Outlays are down $48B, and while a good chunk of this, about $35B is timing, the rest of it looks legit so far… kinda makes me wonder if treasury is “slow paying” vendors or something. Interestingly….the end of the month should see this apparent decrease in outlays get even better. We’ve been talking about it all month….how about $35B of June 2013 cost got sucked into May because of how the weekend fell. June 2012, on the other had had the opposite issue…$30-35B of July 2012 payments went out in June….creating a temporary $65-$70B delta between the two years. We haven’t seen it yet because it happened on June 29….so it hasn’t crept into our charts yet. We’ll catch the other end of this next month…when July 2013 should end up quite a bit higher in outlays.

Fortunately, there is an easy way to filter all of this out….all you have to do is ignore the months and look at a YTD. I don’t typically post these, but I’ll throw them out there today. Through June 24, 2013 has increased revenues 13% vs 2012, while outlays are down 1%. Due to this… the deficit over the same period has dropped from $520B in 2012 to $326B in 2013, a $194B improvement. Looking forward, if the trend follows, we could see a bit more improvement on outlays, but not much…maybe 1-2%, but it’s not a sure thing. Revenues appear to be petering out….the 13% is buoyed by an extremely strong April, as the months go by, April’s weight will drop, and the average will drop. How far…I have no idea at this time. A few days ago, the data was looking like we might be headed down to 5-7% growth. Now…that is looking pessimistic….back to 10-11%?? I guess we’ll just have to wait for the data to find out.