Category

Daily Deficit

July 2015 Deficit

By | Daily Deficit

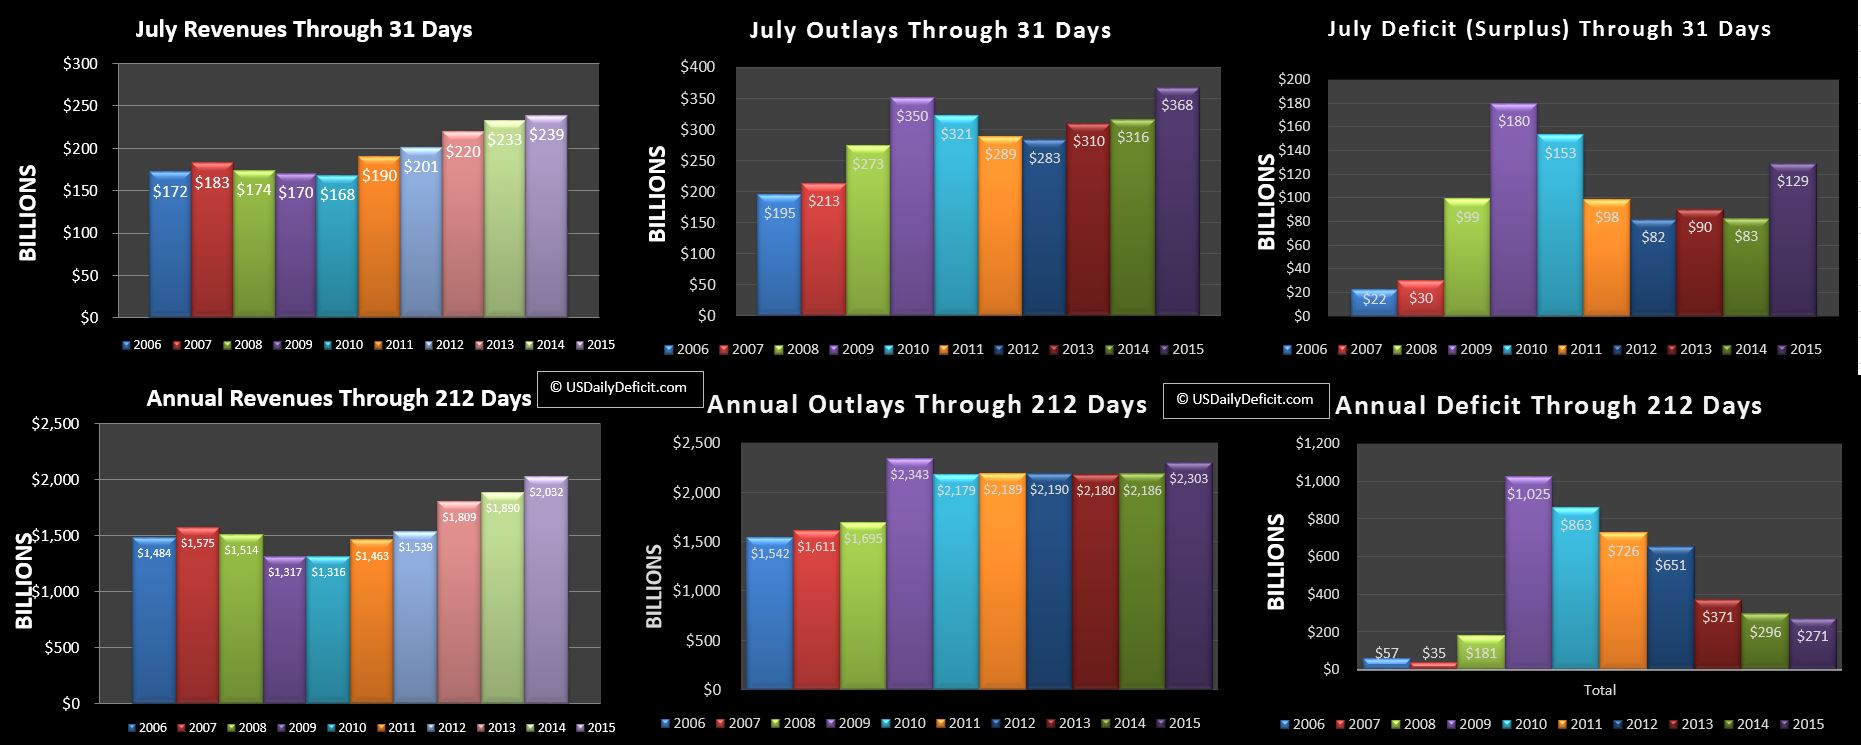
The US Daily Cash Deficit for July 2015 was $129B, topping my $115B forecast primarily due to a surge in Medicare and Medicaid cash outlays.

2015-07-31 USDD

Revenues:

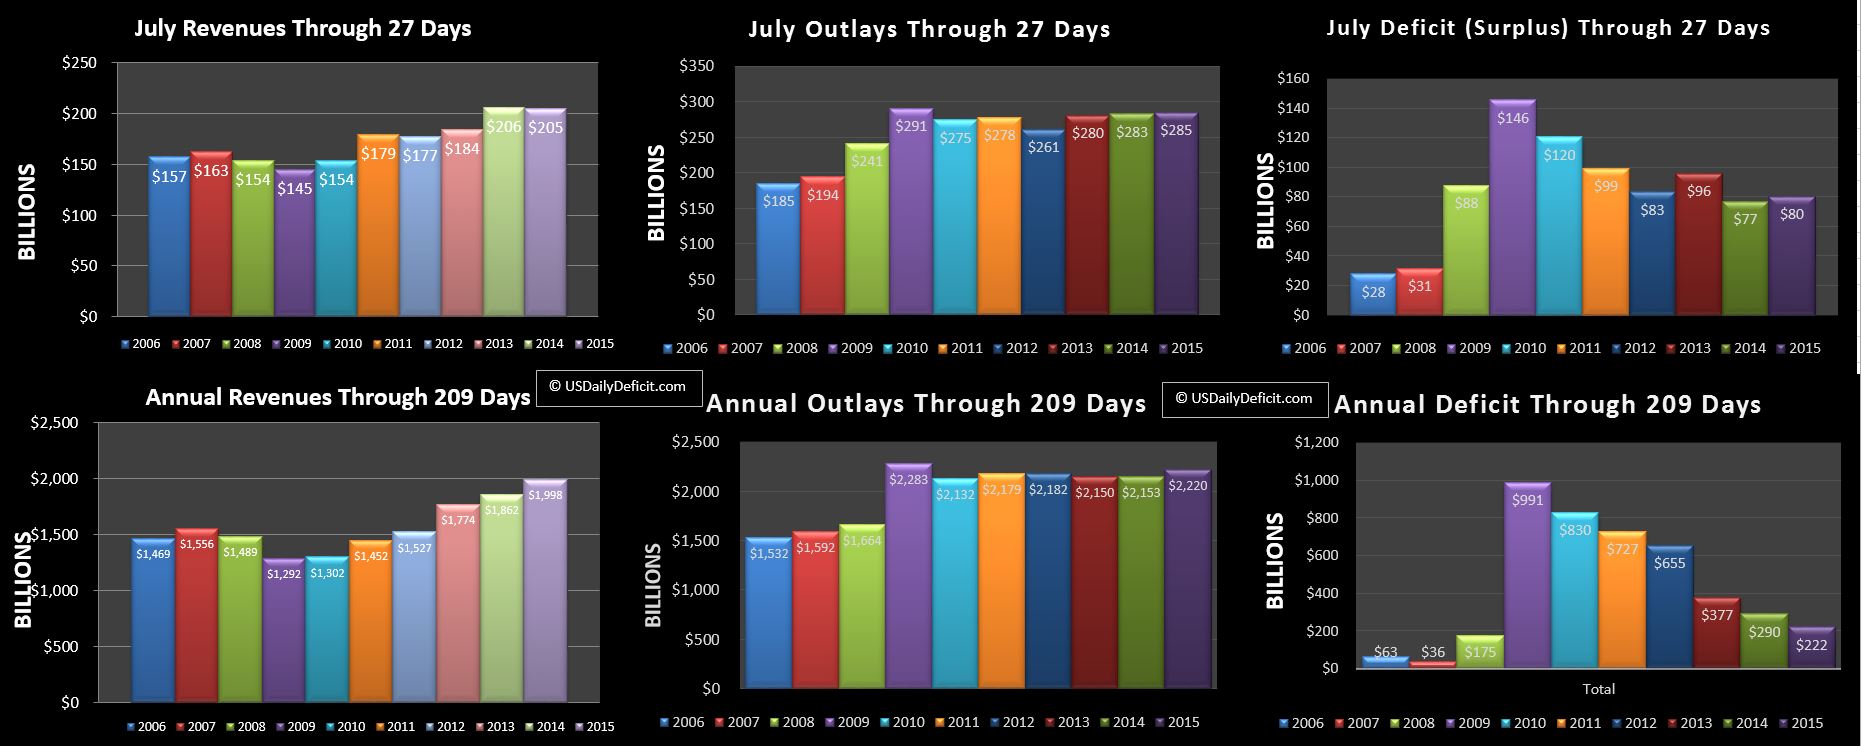
Revenue was up just 2.5% in July compared to the Annual of +7%. However some of that was due to one time cash receipts last year that did not repeat in 2015. Tax deposits were actually up 8%, though pulling out the additional business day would put us closer to +5%. So revenue was a mixed bag in July…not impressive at first glance, but decent after pulling out one time items and timing. For the year, revenues through 7 months are up $142B ggod for a 7.5% YOY gain. This continues to fall as the last 3 months have all been below +5%.

Outlays:

Outlays were up big on timing and outright increases in Medicare/Medicaid/Social Security. August 1 falling on a weekend pulled $40-45B of spending  forward into July. Looking at the year through 7 months, cash outlays are up 5%, but pulling out the timing anomaly puts us closer to 3%.

Deficit:

At $129B, July 2015’s deficit tops last year by $46B….about the same as the timing event, so we should get most of that back in August. Three months doesn’t quite make a pattern, but after a solid start to 2015 with revenue at +10% through 4 months, we seem to be seeing ~5% revenue growth and ~3-4% outlay growth roughly offsetting each other and leaving the deficit itself relatively unchanged. The current trailing 12 month deficit is at $530B goosed a bit by the timing, but if current trends hold (and they never do) we would end the year at ~$450B, good for a YOY $100B improvement.

Default Day:

As we all know, the debt limit was hit back in March at $18.113T. Since then, Treasury has managed to keep the government going by drawing down the sizable cash stockpile (274B after the April tax haul) and by implementing  “Extrordinary Measures” (EM) which allows them to essentially pretend some types of debt do not exist….thus pulling it off the balance sheet and issuing new debt in it’s place. My guess of the amount of total EM available to treasury is $350B, of which they have used about $200B based on some back of the envelope calculations. This plus the current cash balance…$210B at the end of July gives us the cash cushion available to cover future deficits. At the end of July, this amount was ~$360B, down from ~490B at the end of June. Looking forward using my model, $360B should last until about the middle of February 2016….just as tax refund season begins heating up again. This is also right in the middle of the early presidential primaries, so it could get (more) entertaining if they don’t manage to deal with it sooner. My advice to the political establishment would be to fix this ASAP. Nothing would send voters into the arms of Donald Trump faster than having tax refunds delayed right in the middle of primary season. That’s not an endorsement (of anybody)….just saying 🙂

August Forecast:

I’m going to stick with revenue at +5% and outlays at about +3.5%, so pulling out the timing issues, I have the August 2015 cash deficit at $100B compared to last year’s $155B. As always, stay tuned!!

US Daily Deficit 7/21/2015

By | Daily Deficit

The Us Daily Cash Deficit for Tuesday 7/21/2015 was $8.9B bringing the July deficit through 21 days to $75B with 8 business days remaining.

2015-07-21 USDD

The revenue YOY is down $1B, with ~4B of that being Justice department receipts from last year we didn’t expect to see again. If you pull that out, revenues are at ~+2% and slowly gaining….+5% is definitely a possibility but not guaranteed to end the month. After starting the year through 4 months at +10% YOY revenue growth, May/June averaged only 4.5%, and we look like we are headed for a similar outcome. Slowdown?? On the other hand, I suppose +4.5% isn’t too bad, but with Outlays growing at +3.2%, it’s not enough to continue driving the deficit down at the rate we have seen over the last few years.


US Daily Cash Deficit 7/9/2015

By | Daily Deficit

The US Daily Cash Deficit for Thursday 7/9/2015 was $4.8B bringing the July cash deficit through 9 days to $71B.

2015-07-09 USDD

We don’t really see much YOY change at this point, with revenues up a bit and outlays down a bit, leaving us with a $4B improvement in the deficit. It’s really too early to get excited about anything yet, but just to set the baseline, we really need revenue growth to continue to exceed 5% to keep making material progress in reducing the deficit, so this ~1% isn’t going to cut it. Fortunately, it seems like YOY gains typically show up in the second half of the month, so let’s give it a few weeks before we sound the alarm.

I’m getting a bit of a late start this month, so I’ll take a swing at the July deficit forecast with a bit of an advantage. I’m going to assume overall revenues grow at a base rate of about 5%, offset by about a $4B reduction in deposits from the Justice department we saw last year (bank penalties??) that I don’t think we will see again.  On the cost side, most categories will be roughly flat, with the exception of SS, Medicare, and Medicaid which together pull the apparent growth rate to the 3%-4% range. Finally, August 1 is a Saturday, which will pull somewhere between $30B-$40B of cost from August into July. When all is said and done, the July 2015 deficit should end up at about $115B , $29B worse than last July’s $86B deficit. Pull out the timing and we would have shown moderate improvement as revenue gains outpace outlays by a few percent.

June 2015 Cash Surplus

By | Daily Deficit

The US Daily Cash Deficit for Tuesday 6/30/2015 was $1.9B bringing the June 2015 Surplus for the full month to $47B, 3B short of my initial $50B forecast.

2015-06-30 USDD

Revenues:

Revenue ended up at +4.7% good for a $16B YOY increase. It’s not as high as we have seen, but it includes an $~8B reduction in GSE dividends, so I would still say this was a pretty solid month. Withheld Taxes were up 5.5%, taxes not withheld were up 7.4%, and corporate taxes were up 6.4%. For the year, revenues are at +8.3%.

Outlays:

Outlays ended up big at +48B, but about $35B of that was timing that pulled June 2014 costs forward into May. Another $7-$8B was likely the extra business day, and the balance was bonafide increases. no surprises there…Medicare is growing at 9%, Medicaid is growing at 18%, and SS is growing at a little under 5%. For the year, total outlays are running at about 3.5% in what appears to be a breakout from 5 years of flat spending.

Surplus:

At $47B was under June 2014’s $78B which was aided by the timing of outlays. Take that out, and a 4.7% increase in revenues edges out a 3.5% increase in outlays, for a marginal adjusted YOY improvement.

Default-Day:  We ended the month of June with $254B of cash, up from $199B to end May. Backing into the numbers, it actually looks as if “Extrordinary Measures” (EM) were down $15B during the month, bringing the total since EM was deployed in March back down to $115B out of an estimated $350B at their disposal, leaving a 235B cushion. Add to that the current Cash balance of $254B, and the total cash cushion at this point looks to be $489B, which should get us all the way to the middle of next February…so no real change there.

And that closes out a pretty darn good first half of 2015….revenue up 8.3%, outlays up 3.5%. It will be very interesting to see where the second half of the year ends up. It seems like most of the headlines point to economic headwinds…if they pan out we should see it in the revenue numbers, though they will likely lag a bit. As always…stay tuned