Monthly Archives

May 2015

US Daily Cash Deficit 5/28/2015

By | Daily Deficit

The US Daily Cash Deficit for Thursday 5/28/2015 was $1.7B bringing the May 2015 deficit with one day remaining to $106B.

2015-05-28 USDD

Revenues are sitting at +4% and outlays at ~+2%. Not a great month by any stretch, but progress nonetheless. Friday will likely run a $5-10B deficit, still leaving us well under last May primarily due to favorable timing…last May ~$30B +of outlays due 6/1 were pulled into May….this should not repeat as June 1 is on a Monday this year. Next Up…June, which should run a solid surplus in the ~$50B range as quarterly tax payments should boost revenues by ~$140B over May. As always revenue will be key…anything over 5% is pretty good news.

US Daily Cash Deficit 5/21/2015

By | Daily Deficit

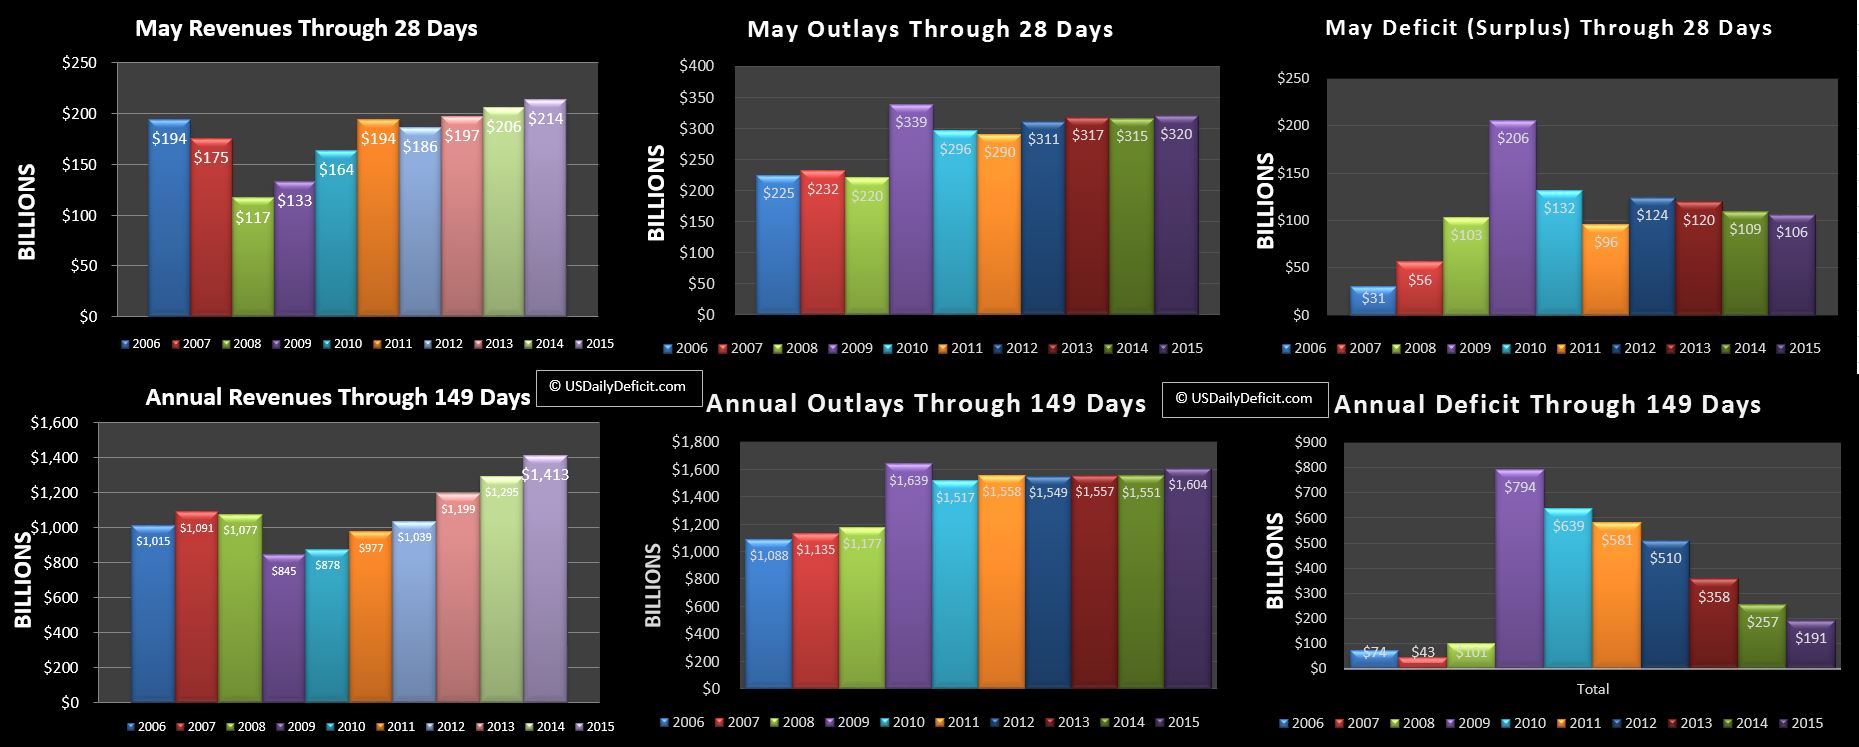
The US Daily Cash Deficit for Thursday 5/21/2015 was 5.1B bringing the May 2015 cash deficit through 21 days to $91B.

2015-05-21 USDD

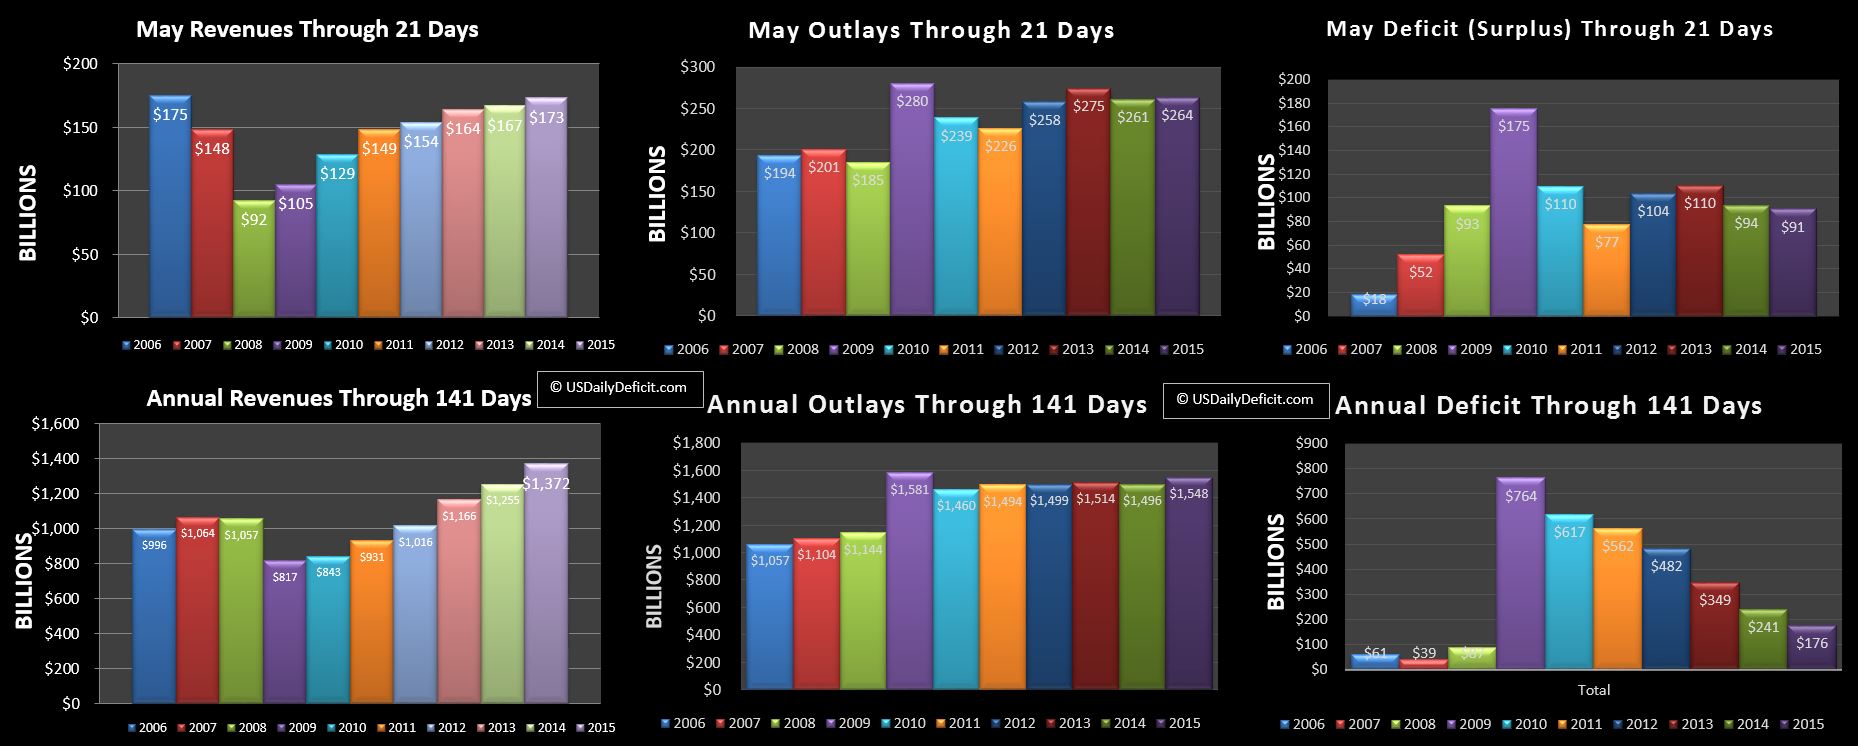
Revenues are back up over 2014 running at +3.7%. Given that May 2015 is down a day, this is a respectable number, even if it’s only a $6B gain. Outlays are up 1% ($3B) giving us a 3B deficit improvement vs 2014 so far. My initial forecast was a $100B deficit for the month, but we appear to be headed a bit over that…say $105-115B. Month end timing is going to cloud the YOY, so right now is probably a clear snapshot of the May baseline….revenue up ~4%, outlays up 1%. Probably won’t make any headlines, but if slow and steady wins the race, this will go down as an ok month. For the year,revenue is at +9% and outlays are at 3.5%.

Just a flashback….the trailing 12 month cash deficit peaked in 9/2009 at $1.817T….as in Trillion. Since then, driven primarily by increased revenues and flat cost, we are closing in on 6 years of more or less uninterupted deficit improvement, probably ending up under $500B at the end of May. Yes…$500B is still a huge number, and yes there are demographic time bombs around the corner, and yes…there could be a recession any second now, but still….crossing the $500B threshhold is something I would have never predicted 3 years ago as I was preparing to launch this blog. My best guess back then was stabilization around $1T for a few years before zooming to infinity and beyond. So…where are is the deficit headed? Down to zero or back to $1T+?

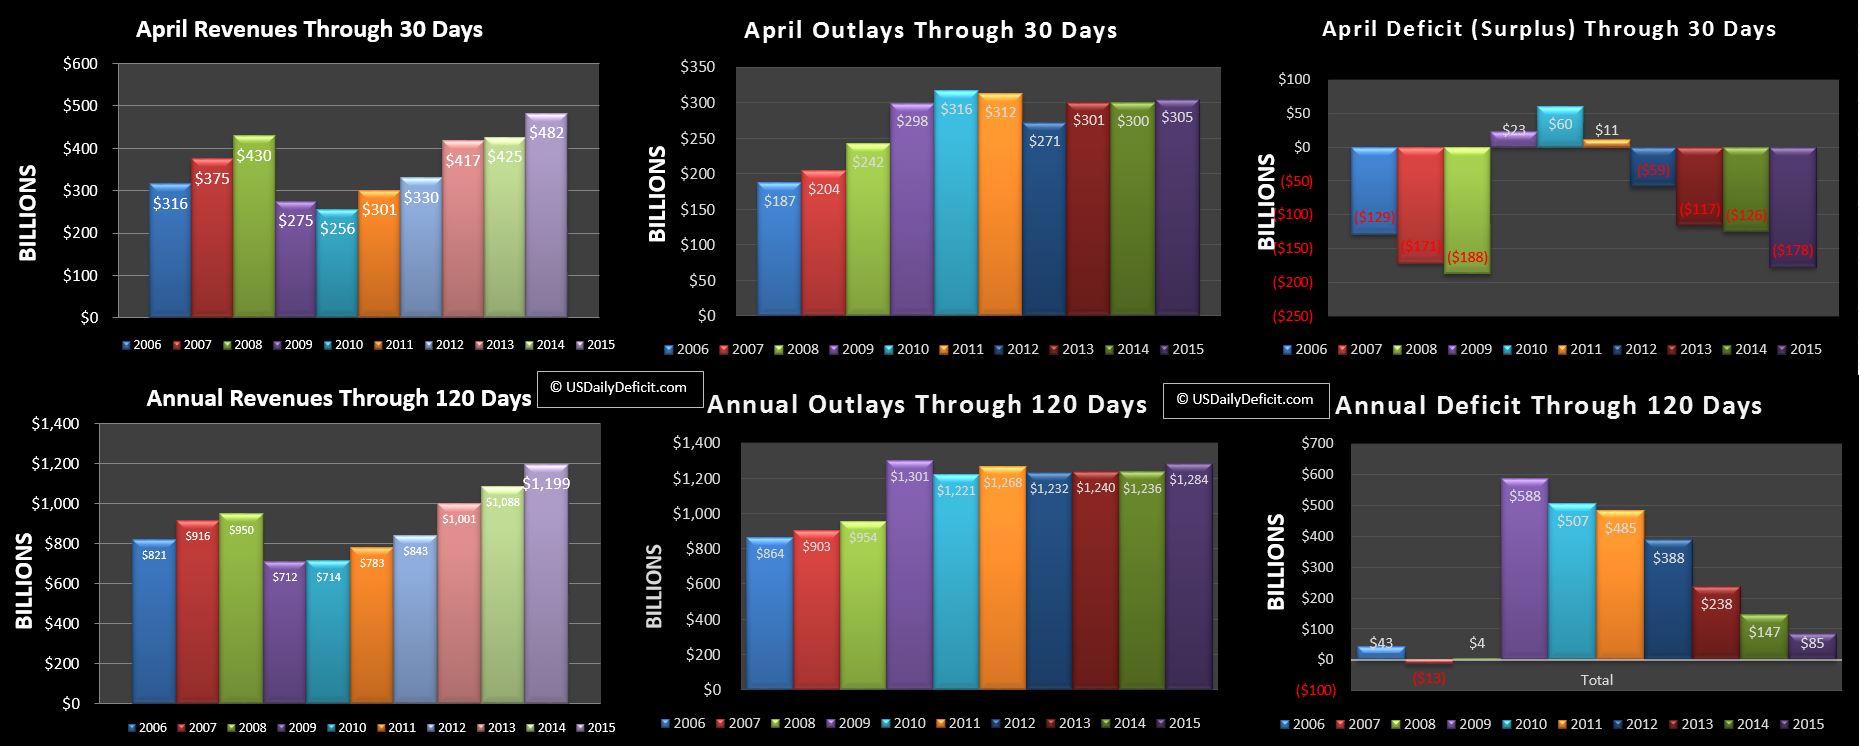
I honestly don’t know, but pulling out a ruler and following this trend, we look to be on track to finish 2015 at about a $400B deficit per year rate. If we assume revenue grows at 7% from there, and outlays grow at 3%, our 2016 deficit is 272B, 2017 is $130B, and 2018 hits a $26B surplus. Is that my forecast?….nope….i don’t have one because my crystal ball is quite broken. The primary question would be….How do we grow revenues 7% when population growth + inflation is maybe 3%??? Hell if I know but that’s more or less what we’ve done for the last 5-6 years, so why not another 3-4… Don’t get me wrong….I’m definately not in the optimist boat here, but it’s getting hard to not to take a look in the rearview mirror and at least notice that things are a hell of a lot better than they were…just look at the bottom right chart above for annual deficit through 141 days. In mid May 2009 we were sitting on a $764B deficit….2015 is less than 1/4 of that at $176B.

**I do realize of course that by letting an optimistic thought out of my head, I’ve probably doomed us all to another great recession…sorry about that 🙁


US Daily Cash Deficit 5/15/2015

By | Daily Deficit

The US Daily Cash Deficit for Friday 5/15/2015 was $26.7B bringing the May 2015 Deficit to $86B halfway through the month.

2015-05-15 USDD

Revenue is down -$3B YOY, due to the one fewer business days, and either a timing event I don’t know about or a ~$5B one time event last year that flew under the radar, and did not repeat again this year. Outlays are up $2B, so we find the deficit up $5B.

We are a bit further behind on revenue than I thought we would be at this point, but nothing to worry about yet.  The rest of May should be fairly low key as we trend up from here. My initial $100B deficit forecast may prove to have been a little bit optimistic if revenues don’t shore up, but I don’t expect anything drastic in the second half of the month.

US Daily Cash Deficit 5/8/2015

By | Daily Deficit

The US Daily Cash Deficit for Friday 5/8/2015 was $1.1B bringing the May deficit through 8 days to $44B.

2015-05-08 USDD

At is standard practice here I have synced up 2014 and 2015 based on the days of week….so we are comparing May 2015 through Friday 5/8/ to May 2014 through Friday 5/9. This gives 2014 an extra business day, a lead it will maintain for the entire month.

Revenues look ok….up $1B despite being down a day. Outlays also look on track….down a bit thanks to the fewer days.


Last May posted a $144B deficit, but I am forecasting this May at just $100B. the primary reason is that last May had a month end timing issue that pulled ~35B of cost from 6/1 into May. this year won’t have that. I am also anticipating revenue continues to have moderate YOY growth (5%-7%) and outlays, are growing at ~3% without timing events. May isn’t nearly as exciting as April…the deficit should trickle up from here, with 5/15 having corporate taxes, plus a big interest payment due. The main key is to keep an eye on YOY revenue….anything over 5% is a keeper.


US Cash Surplus April 2015

By | Daily Deficit

The US Daily Cash Deficit for Thursday 4/30/2015 was $1B bringing the April 2015 full month Surplus to $178B topping both last April’s $125B surplus and my forecast of $155B by a healthy margin. For a better month, you have to go back to April of 2008….yes that 2008…. at $$188B Surplus, which was the best month ever in my data set going back to 1999.

2015-04-30 USDD

Without a doubt Revenue stole the show posting a +$57B gain YOY, good for +13%. Not too shabby given current GDP growth.  Outlays were up $5B, with higher SS/Medicare/Medicaid spending being partially offset by decreases in payments to “Defense Vendors”, “Education”, and “Other”.

For the YTD 1/3 of the way in, Revenues are up 10% and outlays are up 4%, which pencils out to a  $62B YOY improvement down to $85B. We are still on track to hit ~$400B deficit for the full year, including $110B in May alone. Of course, that’s on the current trajectory, which could change course at any time.

Cash in hand….just $35B at the end of February has soared to $274B as Treasury has opted to keep  debt at the limit rather than pay anything down with their cash hoard. We are now a month and a half into “Extraordinary Measures” (EM) , and back of the envelope I would guess they have burned through about $100B of ~$350B of this accounting magic trick. So $250B of EM, and $274B of cash in hand gives us $525B of cushion before the vault is empty. This gets us all the way to next February’s tax refund season, and the primaries for the 2016 presidential race. I’m not sure if that’s good or bad, but I’m guessing it will get some press coverage, so mark your calendar:)

Put it all together, and it was a really good month. The key here will be to see how May and June follow this up. Remember that a good chunk of the taxes paid in April were related to last year, so April isn’t always a good indicator of the current trend.