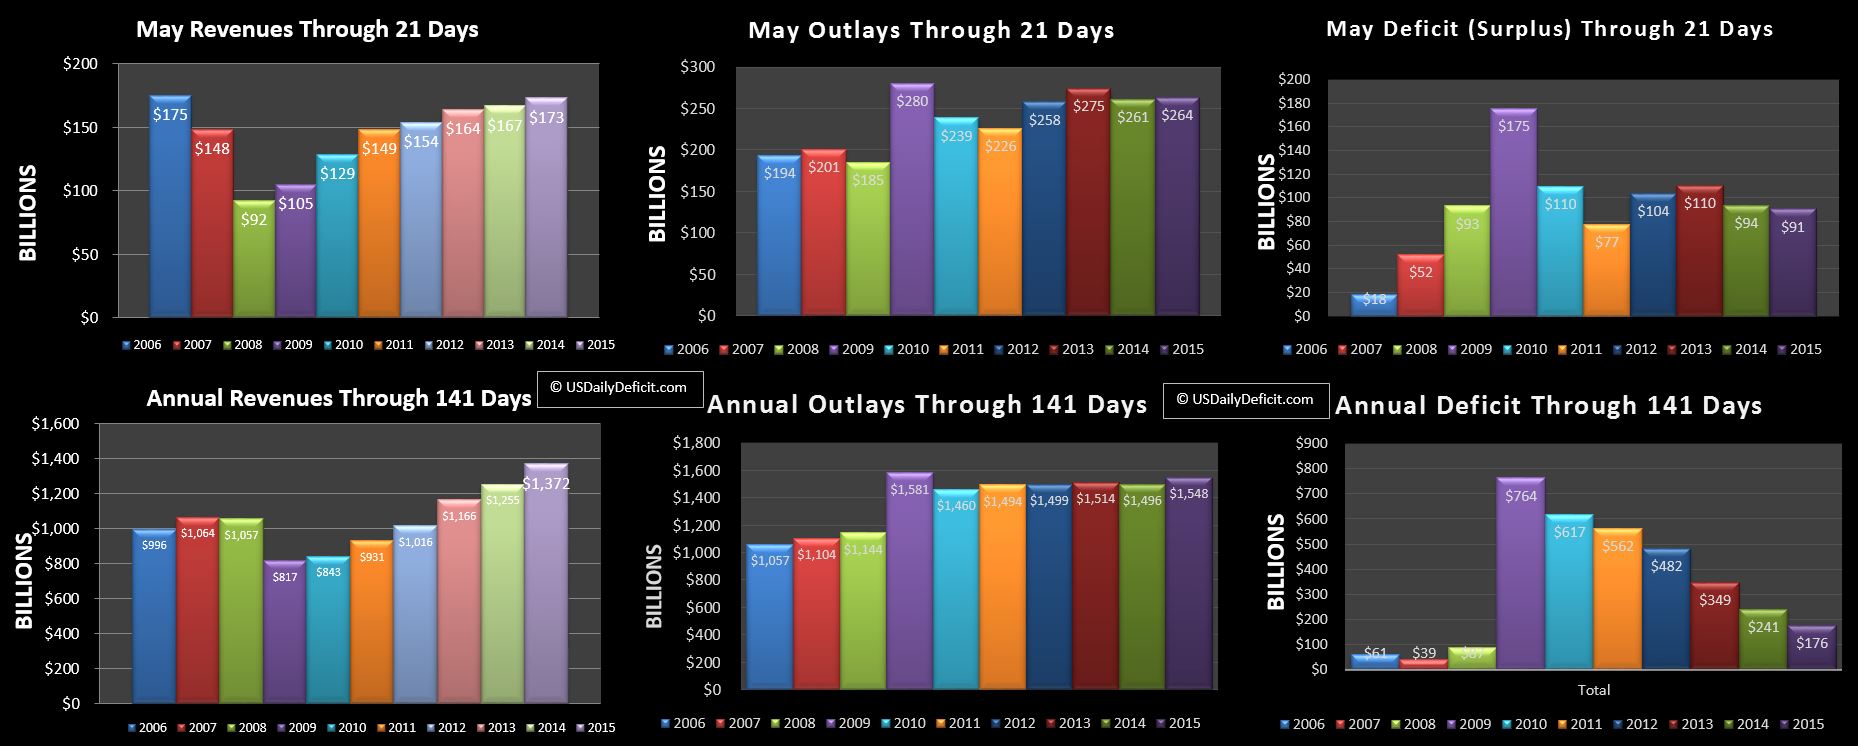
The US Daily Cash Deficit for Thursday 5/21/2015 was 5.1B bringing the May 2015 cash deficit through 21 days to $91B.
Revenues are back up over 2014 running at +3.7%. Given that May 2015 is down a day, this is a respectable number, even if it’s only a $6B gain. Outlays are up 1% ($3B) giving us a 3B deficit improvement vs 2014 so far. My initial forecast was a $100B deficit for the month, but we appear to be headed a bit over that…say $105-115B. Month end timing is going to cloud the YOY, so right now is probably a clear snapshot of the May baseline….revenue up ~4%, outlays up 1%. Probably won’t make any headlines, but if slow and steady wins the race, this will go down as an ok month. For the year,revenue is at +9% and outlays are at 3.5%.
Just a flashback….the trailing 12 month cash deficit peaked in 9/2009 at $1.817T….as in Trillion. Since then, driven primarily by increased revenues and flat cost, we are closing in on 6 years of more or less uninterupted deficit improvement, probably ending up under $500B at the end of May. Yes…$500B is still a huge number, and yes there are demographic time bombs around the corner, and yes…there could be a recession any second now, but still….crossing the $500B threshhold is something I would have never predicted 3 years ago as I was preparing to launch this blog. My best guess back then was stabilization around $1T for a few years before zooming to infinity and beyond. So…where are is the deficit headed? Down to zero or back to $1T+?
I honestly don’t know, but pulling out a ruler and following this trend, we look to be on track to finish 2015 at about a $400B deficit per year rate. If we assume revenue grows at 7% from there, and outlays grow at 3%, our 2016 deficit is 272B, 2017 is $130B, and 2018 hits a $26B surplus. Is that my forecast?….nope….i don’t have one because my crystal ball is quite broken. The primary question would be….How do we grow revenues 7% when population growth + inflation is maybe 3%??? Hell if I know but that’s more or less what we’ve done for the last 5-6 years, so why not another 3-4… Don’t get me wrong….I’m definately not in the optimist boat here, but it’s getting hard to not to take a look in the rearview mirror and at least notice that things are a hell of a lot better than they were…just look at the bottom right chart above for annual deficit through 141 days. In mid May 2009 we were sitting on a $764B deficit….2015 is less than 1/4 of that at $176B.
**I do realize of course that by letting an optimistic thought out of my head, I’ve probably doomed us all to another great recession…sorry about that 🙁
