Monthly Archives

March 2014

US Daily Cash Deficit 3/26/2014

By | Daily Deficit

The US Daily Cash deficit for Wednesday 3/26/2014 was $13.7B bringing the March 2013 cash deficit to $39B through 26 days.

2014-03-26 USDD

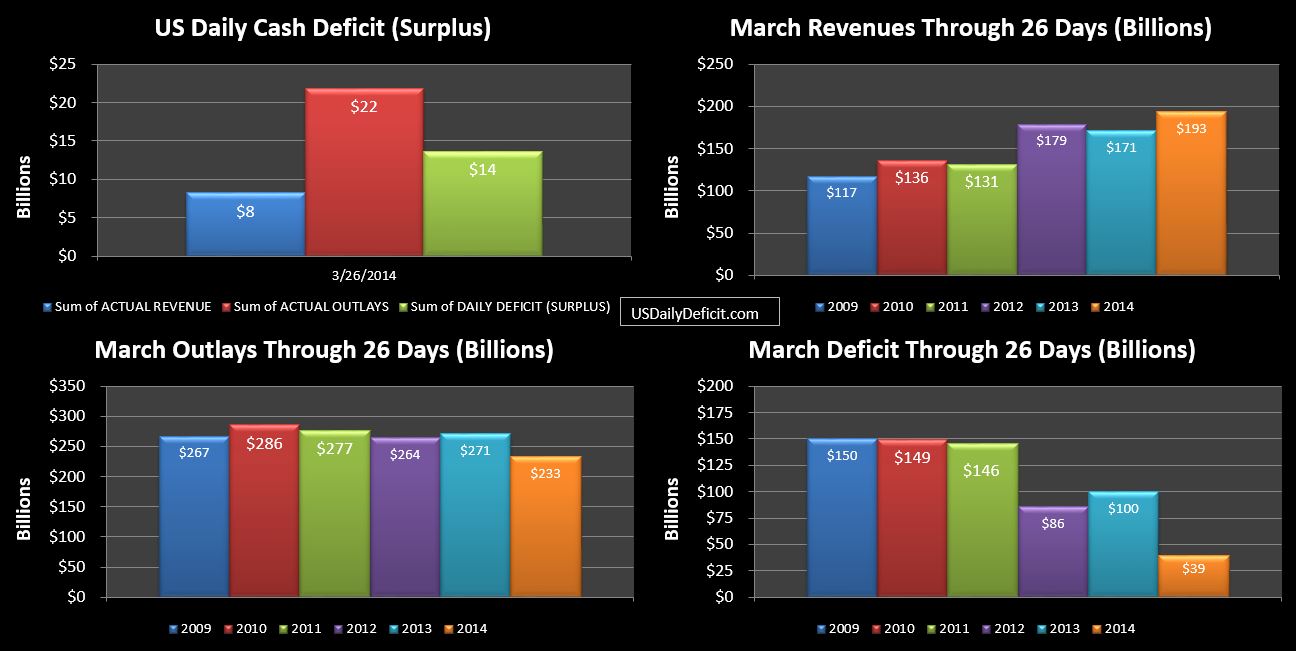
Revenues are up 13% so far and will likely gain a bit more over the next 3 business days. At this point…about half is due to lower tax refunds and the rest higher tax revenues. Outlays are down, but this can almost entirely be explained by the beginning of the month timing that pushed about $35B from March and into February.

The deficit currently sits at $39B with 3 days remaining. Thursday will likely post a moderate deficit, Friday a healthy surplus, and Monday 3/31 a large surplus on end of month payments including Fannie/Freddie payments. It seems likely that the deficit will shrink from here, but making it all the way to surplus seems like a bit of a stretch, though still possible.

Regardless, this is shaping up to be a good month considering last March posted a $94B deficit, and this March is knocking on surplus territory. Sure… a good chunk is timing, but the year is looking good too, with Revenues up about 10% and outlays down 1.5%. One more month of that, and this pessimist may just have to change his tune…at least for the short run. Projecting this trend out puts us at a sub $400B deficit for the calendar year…still a huge deficit, but a huge improvement over where we’ve been.

US Daily Cash Deficit 3/21/2014

By | Daily Deficit

The US Daily Cash Deficit for Friday 3/21/2014 was $4.5B bringing the March 2014 deficit through 21 days to $26B for the month with six business days remaining.

2014-03-21 USDD

No real movement since the last post. End of month’s can get a bit messy, but there is no reason at this time to move materially away from my original forecast of a $15B deficit for the month. Looking at the remaining days… odds are we’ll end up under that, perhaps even at a surplus if we end the month with strong revenues, but don’t look for a huge beat, even with some nice big checks from Fannie/Freddie headed our way 3/31.

Perhaps more interesting is the coming month of April. Typically the best month of the year thanks to 4/15 tax payments, last April posted a $117B surplus as revenues surged 27% YOY. If they continue surging, seeing a $150-$200b surplus next month seems likely assuming 8-10% growth….growth over that could spike the surplus even more.

February 2014 Update: Social Security Enrollment

By | Commentary

In February, the SS rolls added 120k people….up from January’s 103k, but down from February 2013’s 159k add. February is typically the largest add of the year, so no real surprises here.

2014-03-20 February SS Analysis

The above chart shows the TTM change starting in 2007 with an annual rate of about 700k, spiking to 1.6M in 2009, and trending down since. We are still well above 1M at 1.138M, but we have 4 months of decline…note that this is just a decline in annual additions…we are still adding at a historically high rate, just not as high as the peak of the recession. That said, the 4 month trend does look steeper than anything we’ve seen since the peak. Perhaps Boomers close to retirement are deciding to stay in the labor force a bit longer….holding the rate down for now, and ultimately increasing their payouts.

Looking to the cash outlays on the DTS, YOY growth comparing this trailing twelve months to the prior shows about an 8% growth which is made up by growth in population, COLA increases, and by an increase in average payouts….driven by new enrollees having higher monthly payouts than the existing population….for example in a given month an 85 year old recipient with an $800 monthly payment passes away and a 66 year old recipient files for the first time with a $1500 per month payment…..population stays the same, average payout goes up.

The primary reason I monitor this is to spot the early stages of a new recession driven spike in enrollment…. If anything we see exactly the opposite, which is the same sign we are getting from surging tax revenues for going on 2 years straight. Very curious….

US Daily Cash Deficit 3/19/2014

By | Daily Deficit

The US Daily Cash Deficit for Wednesday 3/19/2014 was $11.2B bringing the March 2013 cash deficit through 19 days to $15B with 8 business days remaining.

2014-03-19 USDD

Revenue was up driven by Federal Reserve “Earnings” if you want to call them that and lower tax refunds. Outlays were up a bit as well primarily driven by a $12.7B SS payment bringing the monthly total to $50.7B with one large ~12B payment remaining next Wednesday.

As it stands, March revenue is sitting at +13% already even though it is down a business day to 2013, so look for that to continue to grow. For the year, we are currently at +10% revenues…outlays are down 2%.  It’s still early, but this is looking like it may be another year of great improvement….and that’s coming from an admitted pessimist 🙂

US Daily Cash Deficit 3/18/2014

By | Daily Deficit

The US Daily Cash Deficit for Tuesday 3/18/2014 was $7.0B pulling the month back to a deficit…$4B for the month through 18 days.

2014-03-18 USDD

The day was pretty much in lockstep with last year, so no news there. For the month, one of the interesting series I am following is Medicaid outlays. After averaging a little under $22B per month in 2013, we’ve seen what looks like a jump to just under $24B per month through 2 months of 2014. 2013 growth was at 5% over 2013….2014’s current pace is about 11% over 2013. Now we know that Medicaid was expanded by Obamacare, so I would guess that has something to do with it. However, I would have guessed that Medicaid payments for new enrollees for service 1/1/2014 would take a few months to be processed as cash payments….but we clearly saw the increase in January. It will be interesting to see where March ends up. Another $24B month would pretty much confirm that the last 2 months were not just random noise. Anything over $26B would be alarming. We are currently at $14.35B through 12 business days with 9 remaining. Pencil that out, and you get to $25B. However…this series is a bit random in its day to day, so we’ll just have to wait and see.

Finally…for a bit of perspective on that ~$2B increase….revenues were up YOY $36B over the last 2 months for an $18B/month rate. As long as revenue continues to grow at that rate….the deficit will continue to shrink….even against the growth in SS/Medicare/Medicaid. However…when that revenue growth stops or goes negative…watch out!!