Monthly Archives

September 2013

August 2013 US Cash Deficit

By | Daily Deficit

The US Daily Cash deficit for 8/30/2013 was $36.5B bringing the August 2013 Cash deficit to $173B over the full month. This is a $38B improvement over last August at $211B, but after adjusting for about $25B of timing, it reflects a only moderate $13B improvement.

08-30-2013 USDD

The story is all in revenues…up a meager $1B…less than 1% in a year that averaged 18% YOY increase over the first 6 months thanks to tax increases, moderate increases in employment, and of course, a $60B payday loan from Fannie Mae. Digging into the details…it wasn’t all gloom, tax deposits were actually up $8B…offset by an $8B decrease in TARP Receipts…an issue I detailed 9 months ago in We Won’t Miss TARP, But Uncle Sam Will. We’ll see this again in September as last year’s $23B of TARP revenue is likely to fall down to $1-2B or so.

Overall, I have to say this was clearly a disappointing month, but I’m not sure yet if the revenue slide is just an anomaly, or a bona fide shift in the trend. September should give us a pretty good idea which…especially the corporate tax deposits and the “taxes not withheld”. I’ll try to do a more detailed write up later in the month, but this will have to do for now…

September 2013 Deficit Preview

By | Daily Deficit

While we await the August final deficit numbers, I thought it would be a good time to take a look at what September has in store for us.

As a quarter end month, we should see some strong revenues around the middle of the month as corporate taxes and taxes not withheld from paychecks are remitted to Treasury. All in, we will likely see about $100B more revenue in September than we did in August, resulting in a monthly surplus of about $70B, though this is still using some pretty healthy YOY revenue assumptions more in line with what we saw in the first half of the year. Given that the last two months have shown a marked decline from those initial rates, this $70B surplus could be a bit optimistic if we continue to see sub 10% YOY revenue growth.

On the outlays side, against the backdrop of sequestration, we would typically expect a  2% or so decrease in outlays…primarily from defense vendors. However, September 2012 managed to push $25B of SS outlays into late August…September 2013 will not have this benefit, and thus, we will probably end up seeing higher YOY outlays over the month as reductions in outlays will not be large enough to offset the timing issues.

For reference, September 2012 posted a $58B surplus, so within the margin of error of what I am projecting for September 2013. The key here, as it has been for most of the year is to keep our eyes on revenues, which could range from +5 to +20%. Outlays are far more stable (and predictable)…adjusting for timing, they will probably be down a few%.  We should know by about 9/21 how the revenue story is shaping up… Stay tuned!!

August 2013 Update : Social Security-Annual Change In Retired Workers

By | Commentary

The August Social Security monthly update came out last week, but I am just now getting a chance to look at the latest results. If you aren’t familiar with the report, basically, it gives us the number of participants in the Social Security program, both the Old Age and Disability portions of the program. It also gives us average monthly payouts per category, and some demographic male/female breakout.

So…in a given month, the given population changes in two ways. First, new people reach retirement age or become disabled, adding to the population. Second, retired workers pass away, or disabled workers recover and join the workforce. Just to frame it, the current population on Social Security is 57.554M or 18% of the total US population and the average monthly payout is $1,162 per month.

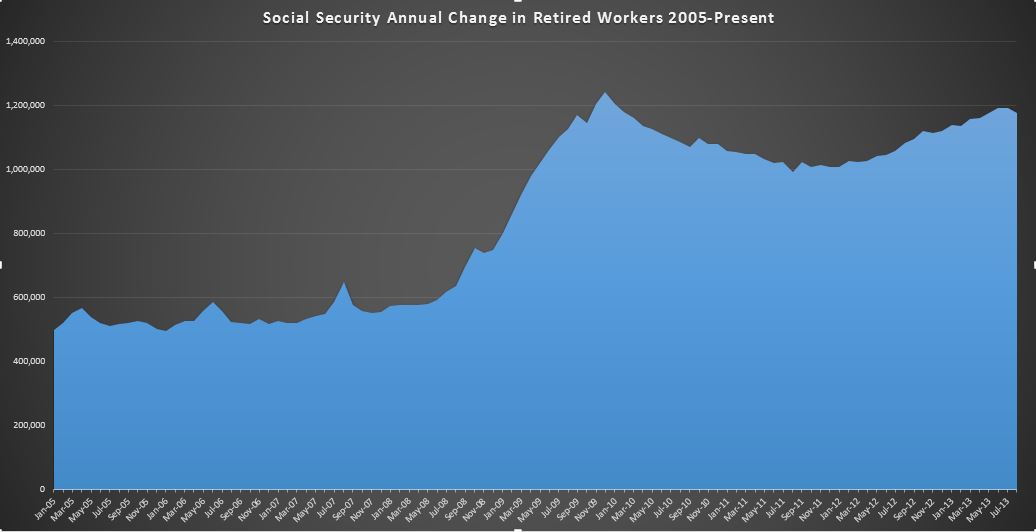
In my prior two posts on June and July, I focused primarily on the retired worker population…by far the largest at ~37M. To continue that analysis for August, the monthly change was an increase of 71k over the prior month ending up at 37.575M people compared to last months increase of 112k people. So great news right? Well…not exactly. See,  there is a lot of seasonality involved, driven by retirement and death patterns that cause a lot of variation in rates over the year. December is generally the lowest,  at 59k in 12/2012. January is typically the highest at 171k of additions in 1/2013. The rest of the months fall somewhere in between. So…rather than comparing the monthly change to the prior month…it is best to compare to the year ago delta.

August 2012 had an increase of 85k, so this is an actual improvement, bringing the TTM change down a hair from 1.191M to 1.177M, still within a stones throw of the December 2009 1.240M record. So despite the small improvement, we are still adding people to the program at nearly a record rate and this rate will almost certainly continue to trend up over the next decade as we get into the meat of the Boomer retirements.
09-01-2013 August Social Security TTM

This is the same chart we’ve seen in prior posts, but I’ve narrowed the range only showing 2005 to present. You can clearly see the 2005-2008 average of about 500k doubling during the great recession to the 12/2009 peak, trending down, and then back up to the current peak just under 1.2M per year rate. You can see the small dip at the end….I wouldn’t get excited about that yet…but we will keep an eye on it.

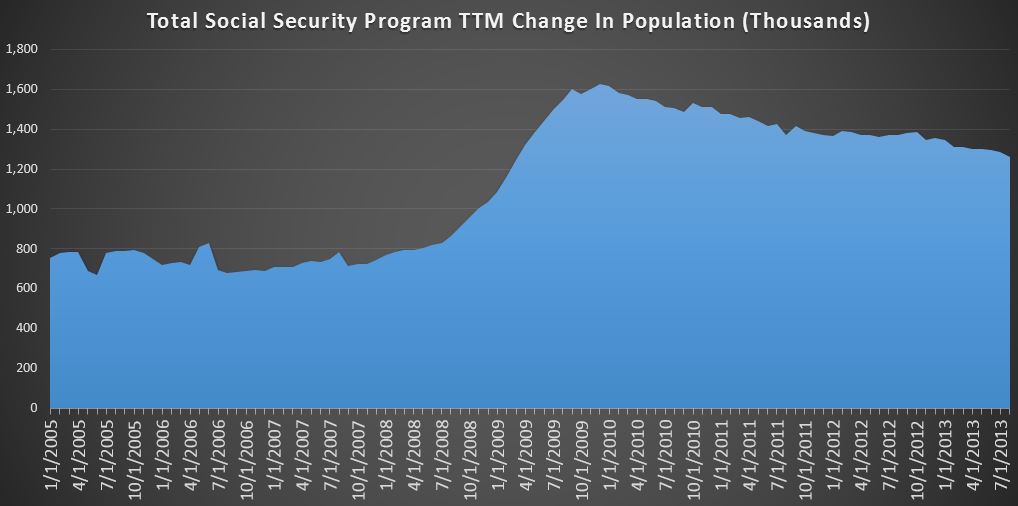
Now, lets take a step back and look at the entire population. It includes disability, currently at 8.9M and growing at about 12k per month over the last year, as well as various subcategories of spouses, widows, and children. The entire population grew 82k to 57.554M, down from the year ago increase of 103k. Lets take a look at the chart:
09-01-2013 August Social Security TTM-Entire Population

This chart looks a bit less menacing. After following the same trend up to 1.6M per year the rate is has steadily declined to around 1.26M per year. As it turns out…most of the other categories seem to have more or less stabilized, with retired workers, and to a lesser degree disabled workers being the only materially changing categories. Still… 3 years past the great recession, we are nowhere near to the normalized rates we saw leading up to 2008. Bottom line, the TTM cash cost of SS related programs was $710B over the last 12 months, and is growing at an annual rate of $60B. By the time the next president takes office in Jan. 2017, that annual rate will be around $922B. By Jan. 2021…it will be closer to $1.2T.

So…to wrap it all up, 85k added to the welfare rolls in August 2013. The overall rate slowly is declining…for now, but the annual add is still nearly twice the pre-recession rate, and likely to turn back up before too long as the Boomers keep retiring in droves. There is no happy ending here…it will just get worse and worse and worse until it is ultimately defaulted on with the rest of the debt.


US Daily Cash Deficit 8/29/2013

By | Daily Deficit

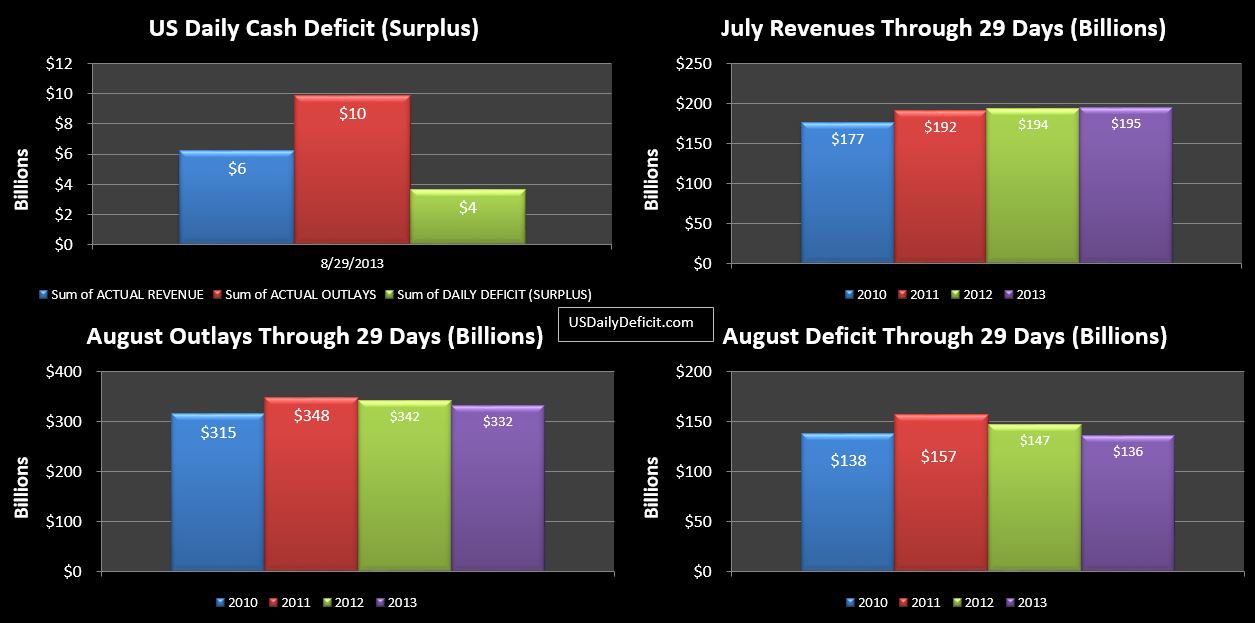
The US Daily Cash Deficit for 8/29/2013 was $3.6B bringing the August 2013 Cash Deficit to $136B with one business day remaining.  Revenues finally surpassed the pace set by last year by $1B, and another $10B or so on 8/30 would put us at YOY growth of a meager 1%. For reference, the first 6 months of 2013 ran at +18%, and July came in at +9%.

Interesting…. though I am inclined to average them together….at 5% revenue growth. This, to me, seems like what may emerge as the new normal…not the 11-12% the CBO has forecast for the next couple of years. With a $3T annual revenue baseline, the difference between 5% and 11% growth is about $200B in 2014 and $400B in 2015….and it grows exponentially from there.

08-29-2013 USDD

With one day remaining….expect a $30-40B deficit tomorrow (well…8/30) substantial, but less than the $64B deficit posted on Friday 8/31/2012, since that day included ~$25B of SS payments due 9/3, but pulled forward due to Labor Day.

Outlays are worth noting today since come tomorrow they will be thrown out of sync….are down $10B. Just scanning through the categories…Defense vendor payments are down $6B and Education Dept outlays are down $3B, with other categories having smaller variances up and down. $10B is a 3% reduction YOY….not too shabby given the offsetting increases in Social Security…but unfortunately, I don’t see this trend lasting beyond the fiscal year end. That said…I didn’t think sequestration would stand, and I was wrong (though pleasantly surprised) on that.