Monthly Archives

September 2013

US Daily Cash Deficit 9/27/2013

By | Daily Deficit

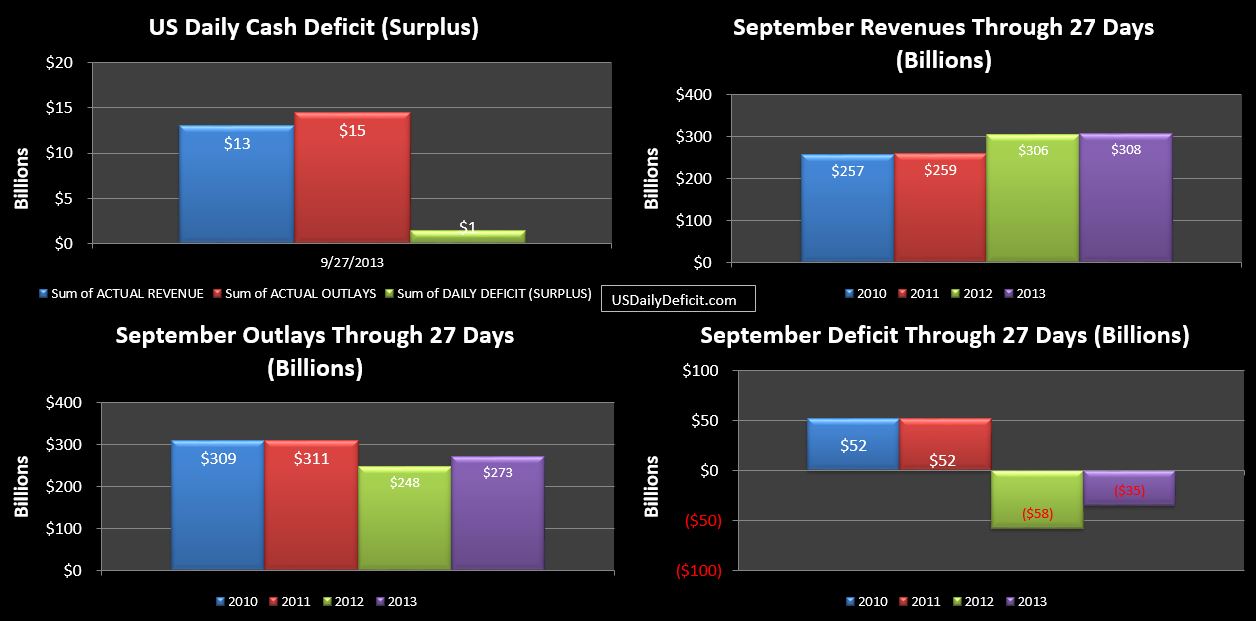
The US Daily Cash Deficit for 9/27/2013 was $1.5B bringing the September 2013 Surplus through 27 days to $35B. I half expected a moderate surplus today, but it wasn’t to be.

09-27-2013 USDD

So at this point, we are comparing all of September 2012 to September 2013 with one (extra) business day remaining. Revenues are back to flat at only +$2B (0.7%) YOY. Part of that is timing….the last day of the month often has higher than average revenues as special payments are made….like the Fannie/Freddie payments. last year those happened on 9/28..a Friday. this year they will happen on 9/30, a Monday. So we will likely see heavy inflows Monday.

My beginning of the month forecast was a $70B surplus, but that is looking a bit optimistic at this point sitting at $35B, with only one day left. There’s a lot of uncertainty, but we will likely see a large surplus 9/30, I’d guess in the $15-$25B range…$35B would be quite a surprise to me. We’ll find out tomorrow…assuming Treasury is still publishing the DTS during the apparently imminent government shutdown.


US Daily Cash Deficit 9/26/2013

By | Daily Deficit

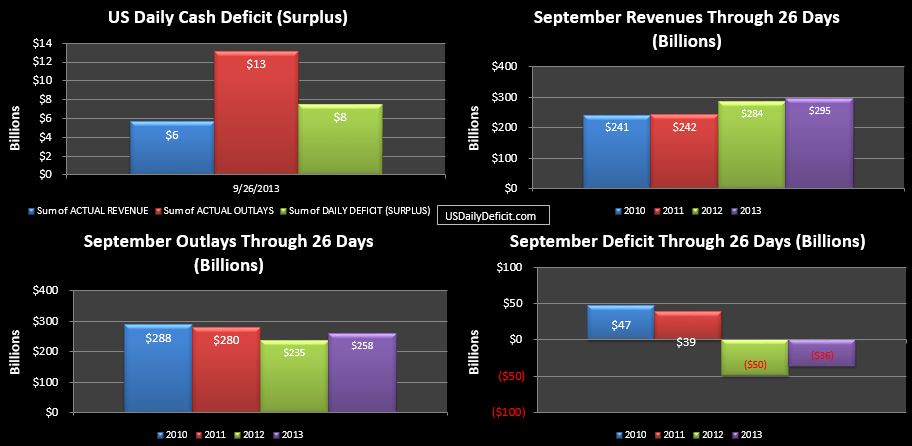
The US Daily Cash Deficit for 9/26/2013 was $7.5B bringing the September 2013 Surplus down to $36B with two business days remaining in the month.

09-26-2013 USDD

Revenue from “Taxes Not Withheld” plummeted under $1B to $388M…..a bit more than expected, but not concerning. Total revenue is now up 3.6% YOY … Outlays are up 10%…all timing, else they would probably be down a little. 2 days left…I expect surpluses both days, especially Monday 9/30, but how much is yet to be seen.

US Daily Cash deficit 9/25/2013

By | Daily Deficit

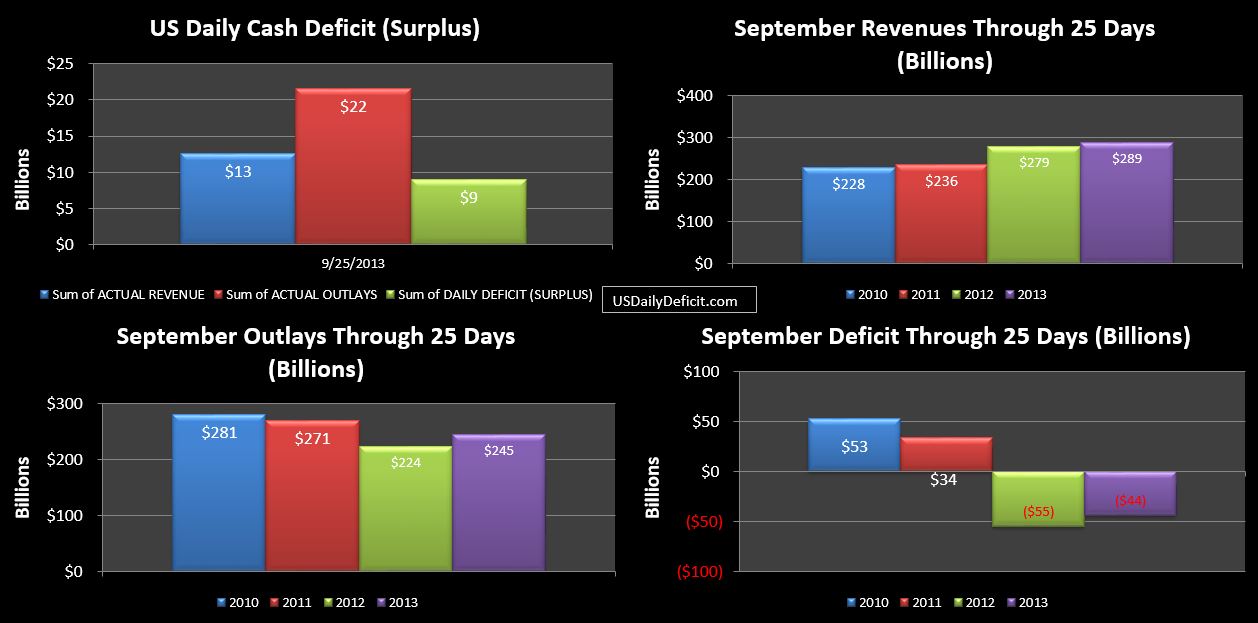
The US Daily Deficit for 9/25/2013 was $9.0B knocking the surplus through 25 days down to $44B with Three business days remaining. Tax deposits not withheld fell to $1B from $4B yesterday….more or less in line with the drop off we expected. For the month, this category is currently up $9B over last year, good for an 18% YOY gain. On the other end of the spectrum, Corporate taxes are basically flat at a little less than 1% YOY, while taxes withheld from paychecks are up 11%.

09-25-2013 USDD

Total revenues, currently up $10B YOY (3.5%) should continue to grow…before getting a big boost Monday, which is an extra workday over last September and a Monday at that. With strong Fannie/Freddie “dividends”…tacking on another +20B of YOY revenue seems feasible…which would put us pretty close to the +10% we want to see.

On the other hand, that extra business day also gives us an additional day of outlays, which are already at +21B thanks primarily to timing. I’m sticking to my $70B surplus forecast for the rest of the month, though it is starting to look a bit high. However, you never know what kind of fiscal year end surprises are in store, so I’ll be an optimist and hold tight.


September 2013 Update : Social Security-Annual Change In Retired Workers

By | Commentary

The September numbers were just released…. the total Social Security population grew 140k to 57.695M people, with the average recipient receiving $1,162 per month. Penciling that out yields a very large number, but that’s not really what I am interested in. I watch this series because I am looking for a material change in the rate of retirements….which is what we would expect some time soon as we get into the meat of the baby boomer retirements.

For some reference, in the late 90’s, we were adding about 300k people to Social Security programs(Old age and disability) per year. By 2006/2007, the rate had edged up to about 700k per year of additions before spiking to over 1.6M in 2009 as millions jumped onto Social Security/disability after losing jobs due to the recession. Since then, it had slowly been drifting down, with the latest annual rate being 1.248M additions per year. For the month, last September had 155k additions, 15k higher than this September so the slow drift downward is continuing, but we are still adding a lot of people each year.

I guess you could say it’s a good thing that the rate is coming down, but the truth is, we are still adding people at a phenomenal rate, and that rate will likely be heading back up before too long. For reference…while SS is adding an average of 104k people to it’s rolls each month…the total population is growing at about 187k per month, and jobs are being added at 184k per month over the last 12 months. On the cost side, we are seeing growth of about $62B per year due to growth in the population and the annual cost of living adjustment. So all else equal, to keep the budget deficit constant, we need either 62B of new revenue each year, or need to make $62B in cuts….each year in perpetuity, and that # will probably start accelerating up over the next 5 years. So it’s bad, and getting worse. Remember all the drama last year surrounding the $85B sequestration?

Finally, just a thought on retirement choices. For most, you have a choice to apply for social security from when you turn 62 all the way up until 70, but the longer you wait, the more money you get. I suspect that for those who can, they try and work as long as they can. However, during the “great recession” many in the 62+ age group who lost their jobs couldn’t find jobs, and therefore took social security earlier than they would have liked at a reduced rate. Now, the economy isn’t quite as terrible, so more seniors are working just a tad longer…delaying their retirement, but ultimately increasing their potential payout. So while that may be temporarily suppressing boomer retirements, in the long run, the higher payments could actually make the long term situation worse.

On the other hand….why worry about the long run. The odds of this turd staying afloat for another decade, much less 30+ years is slim to none. I suppose one of the reasons I do this is just to document the absurdity in real time. None of this is rocket science. Anybody with a spread sheet and the ability to do middle school level math should be able to sit down and see that none of this will end well….and yet, a (vast?)majority of politicians and citizens seem deluded enough to believe we can just keep kicking the can. Hint Hint….we can’t 🙁
US Daily Cash Deficit 9/24/2013

By | Daily Deficit

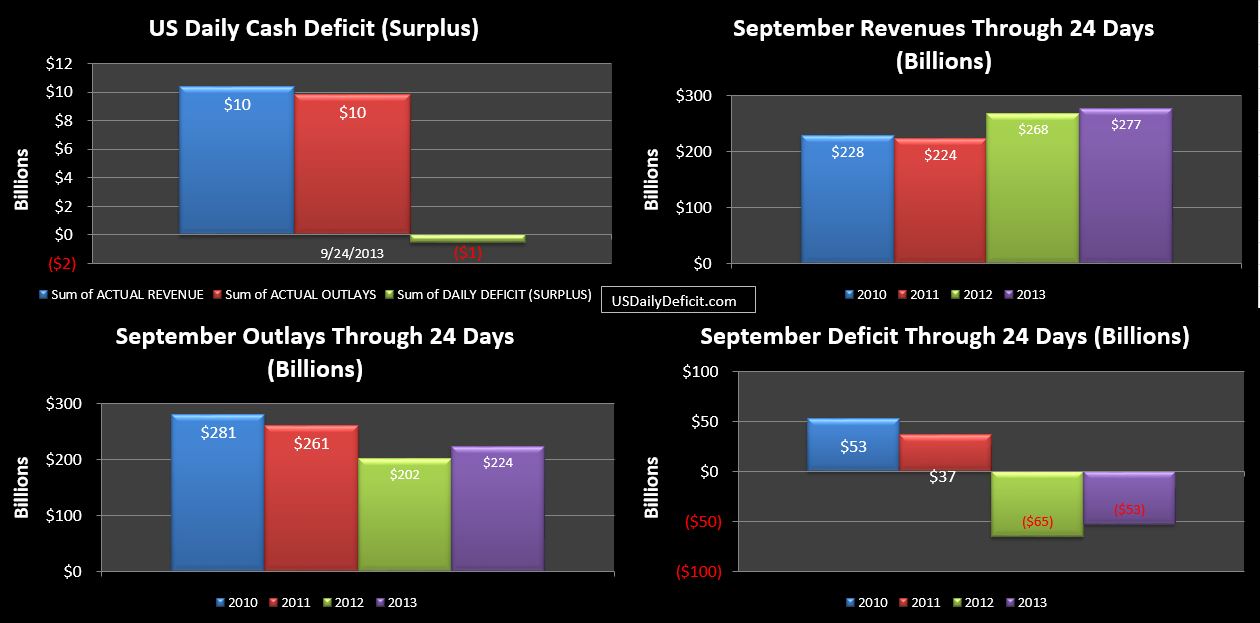
The US Daily Cash Surplus for 9/24/2013 was $0.5B bringing the September Surplus through 24 days to $53B. Revenues from “Taxes Not Withheld” dropped from $9B on 9/23 to $4B on 9/24….stronger than the 2012 amount by $1B, but still indicating these receipts are probably trailing off.

09-24-2013 USDD

Total cash revenues for the month are now running only 3% over last year but should get a material bump on 9/30, ending somewhere between +5%-10%. Not bad, but we may pay for it with a weak October. Tomorrow, we get the final large SS payment of about $12B which will more than likely force the first deficit over $2B that we’ve had in several weeks.

Cash in hand was $55B, which we will probably see grow by $10-20B by month end, lets just say to $70B absent any “extraordinary measures (EM)”. The first week of the month is typically pretty brutal….assuming the government isn’t shut down, we would probably run a $50B+ deficit in that first week of October alone. So Treasuries 10/17 date looks good on paper. However, the CBO also came out with an estimate stating between 10/22 and 10/31. About a month ago, I had guessed early to mid November…citing the difficulty of forecasting without fully understanding what EM magic tricks Treasury had left up their sleeve. Regardless of who is correct, it does seem clear that within the next 6 weeks, either the debt limit will be raised, or we will be in for one hell of a show….maybe even both 🙂