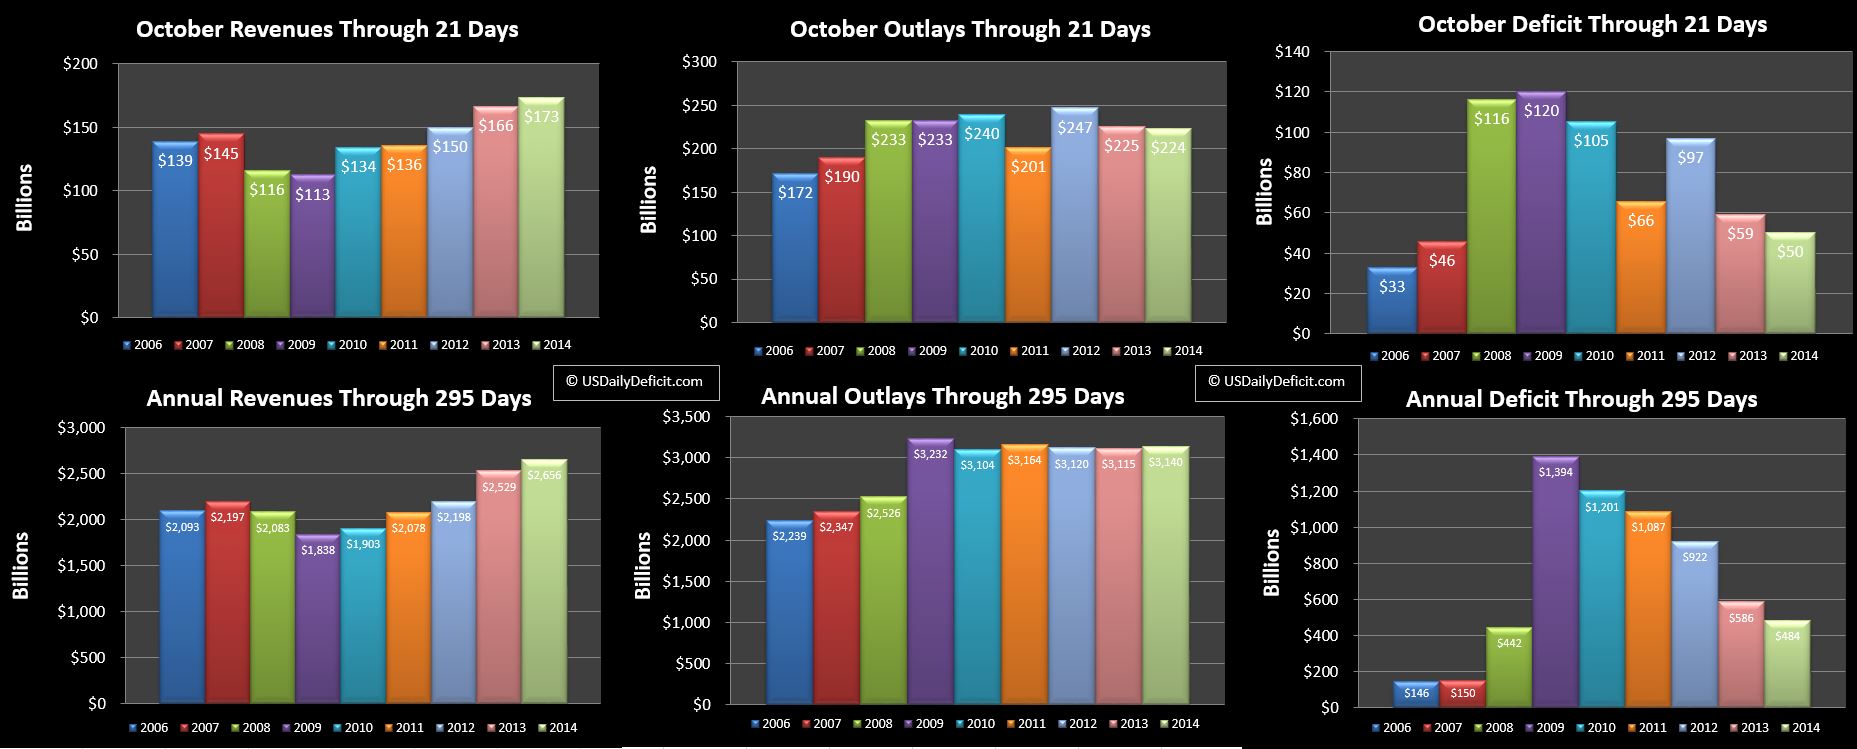
The US Daily Cash Deficit for Tuesday 10/21/2014 was $2.0B bringing the October 2014 deficit through 21 days to $50B and the 2014 YTD through 295 days to $484B.
Very little YOY change on the day, so let’s take a look at our new charts….the YTD charts on the bottom. What we are doing is comparing 2006-2014 revenues, outlays, and deficit through the same number of days….in this case 295. The charts used to only go back to 2009…I’ve added in 2006-2008..interesting times if I recall.
Revenues:
Revenues are obviously on track to hit a new record, but looking back to 2006 gives us a good reference. Over the 8 year period, we look like we are averaging about 3% annual growth in revenues….though obviously there we had a large range of change…from ~-10% to the +~15% we saw in 2013. ~3% is a long term # I can believe in…moderate growth in GDP, plus population growth and inflation.
Outlays:
Our chart clearly shows the huge spike in outlays from 2008-2009, followed by going on 6 years of more or less flat outlays. I tend to think 2015 will be the year we start heading back up, but it’s not likely to be a spike…just a resumption of 2-3% growth.
Deficit:
If you pull 2006-2008 out….you could have a graphic for a democratic campaign poster….not that it would help 🙂 (contact me for licencing info…cash only please :)) This is pretty much the story of the last 8 years…a huge spike followed by annual improvement..but still at a pretty high rate. The question is…..where are we headed? Clearly if the trend continues, we’ll be deficit free in 3-5 years, but I wouldn’t bet on that horse. I’ve been wrong before, but my guess is that we are fairly close to a plateau. Over the next 12 months or so revenue gains will slow and cost pressures will mount resulting in a plateau around the $500B range (annual…charts above are through 295 days). For reference, the TTM deficit through September was at $616B. After that…it will turn around and start heading up at a moderate rate. Of course that assumes no shocks….I can’t forecast those, so I haven’t even tried. Looking back to the last recession…TTM revenues peaked in 4/2008 before falling 17% and bottoming out in 11/2009….lets hope we don’t get another one of those.

Catch up (June/July 2018 Cash Deficit)