Tag

US DAILY DEFICIT

US Daily Cash Deficit 11/7/2014

By | Daily Deficit

The US Daily Cash Deficit for Friday 11/7/2014 was $3.6B bringing the November 2014 deficit through one week to $19B.

2014-11-07 USDD

For the day revenues were up a bit, as were outlays, so no real YOY movement. Revenues are at -$3B and Outlays at -$37B due to reasons discussed in previous posts. there’s not a lot of excitement on the schedule for the rest of the month…it should just be a slow build up to a ~$75B or so deficit. As always…revenues will be of interest…specifically the YOY % gain, as will Medicaid/Medicare/SS growth.

US Daily Cash Deficit 11/4/2014

By | Daily Deficit

The US Daily Cash Deficit for Tuesday 11/4/2014 was $4.2B following Monday’s $12.6B deficit and bringing the November 2014 deficit to $17B through 4 days.

2014-11-04 USDD

No real surprises early in the month. As is typical, I have adjusted the days to sync up 2013 and 2014 based on days of the week rather than straight day of month. So the chart above is comparing November 2013 through Tuesday 11/5 to November 2014 through Tuesday 11/4. This results in 2014 being behind one business day…a handicap it will retain for the remainder of the month.

Revenue starts off the month down just $3B….not a bad start considering we are down a day. To hit +5% we’ll need to get to +10B….10% will require +$20B.

Outlays are off a lot…down $40B, but I would guess $30B is timing….the costs that were pulled into October, and $10B is the missing day. I am not expecting this to change….while November 2014 will end up light on costs due to timing…November 2013 actualy got a double whammy…getting the typical monthly costs plus December 2013’s share…. It’s hard to say with certainty, but November 2014 outlays could be down $60B. This actually happens quite a bit, and is just one of the curveballs that can throw off the monthly analysis.

Of course….timing issues don’t affect our new YTD charts nearly as much as they resolve themselves within a day or two….and are part of a much larger base anyway. Our YTD revenues are up 5.3% and outlays are up just 0.9%.

Looking forward to the full month…I’m guessing we’ll end up around a $75B deficit for November 2014 compared to a $143B deficit a year ago. Timing is the big difference holding cost down, while revenue should be up 5-10% again if the trend continues. November’s gain is December’s loss however…expect a bit smaller surplus than December 2013’s $55B, though i won’t put out an official guess until early December.

US Daily Cash Deficit 10/28/2014

By | Daily Deficit

The US Daily Cash Deficit for Tuesday 10/28/2014 was $6.8B bringing the October 2014 deficit to $66B for the month with 3 business days remaining.

2014-10-28 USDD

For the month, revenues are looking solid at +7% an poised to pick up some more by month end.  10% is certainly within striking distance and probably likely, which would make it the second month in a row with impressive revenue growth. Outlays are down, but should even out Friday when the days even back out…then surpass 2014 on month end timing as ~$20B of payments due 11/1 will get pulled forward into October… unlike last year.

My initial forecast for October was a $100B deficit. 3 days out, it is still looking like a reasonable estimate, but probably a bit on the high side…stay tuned, we’ll have our answer on monday 11/3.

US Daily Cash Deficit 10/23/2014

By | Daily Deficit

The US Daily Cash Deficit for Thursday 10/23/2014 was $3.8B bringing the October 2014 deficit through 23 days to $61B with 6 business days remaining.

2014-10-23 USDD

After a flat start, October is shaping up quite well with revenues at +$14B (+8%) and outlays down -$5B, though they will almost certainly end up higher thanks to an extra day and month end timing.

For the year, revenues are up 5%, and outlays ~1%, leaving the deficit $111B under where we were last year with a little over two months left in the year.

US Daily Cash Deficit 10/21/2014

By | Commentary

The US Daily Cash Deficit for Tuesday 10/21/2014 was $2.0B bringing the October 2014 deficit through 21 days to $50B and the 2014 YTD through 295 days to $484B.

2014-10-21B USDD

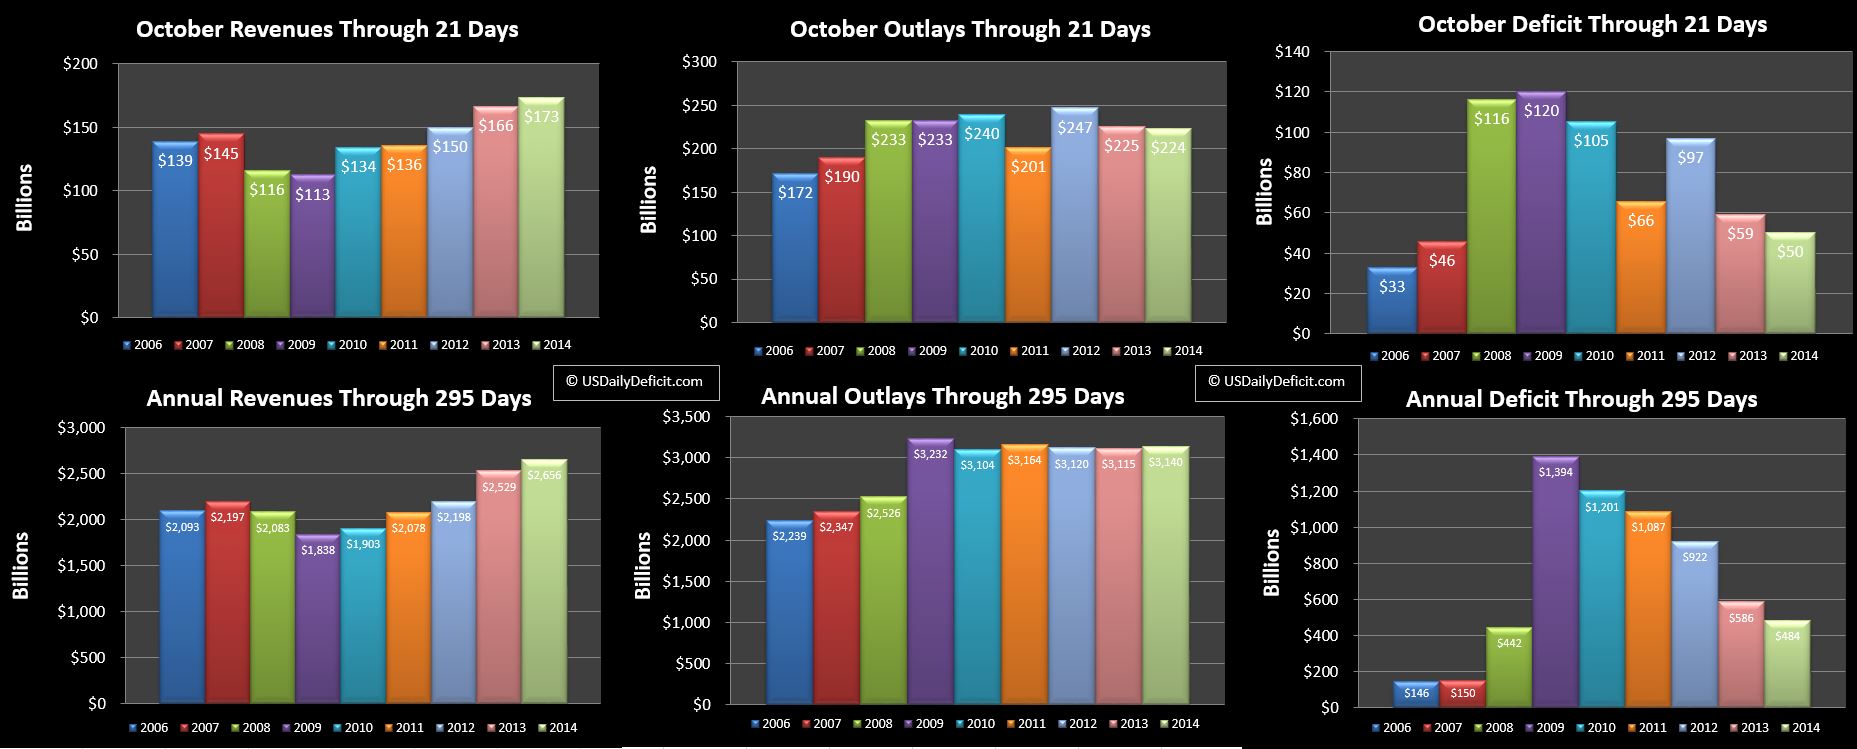
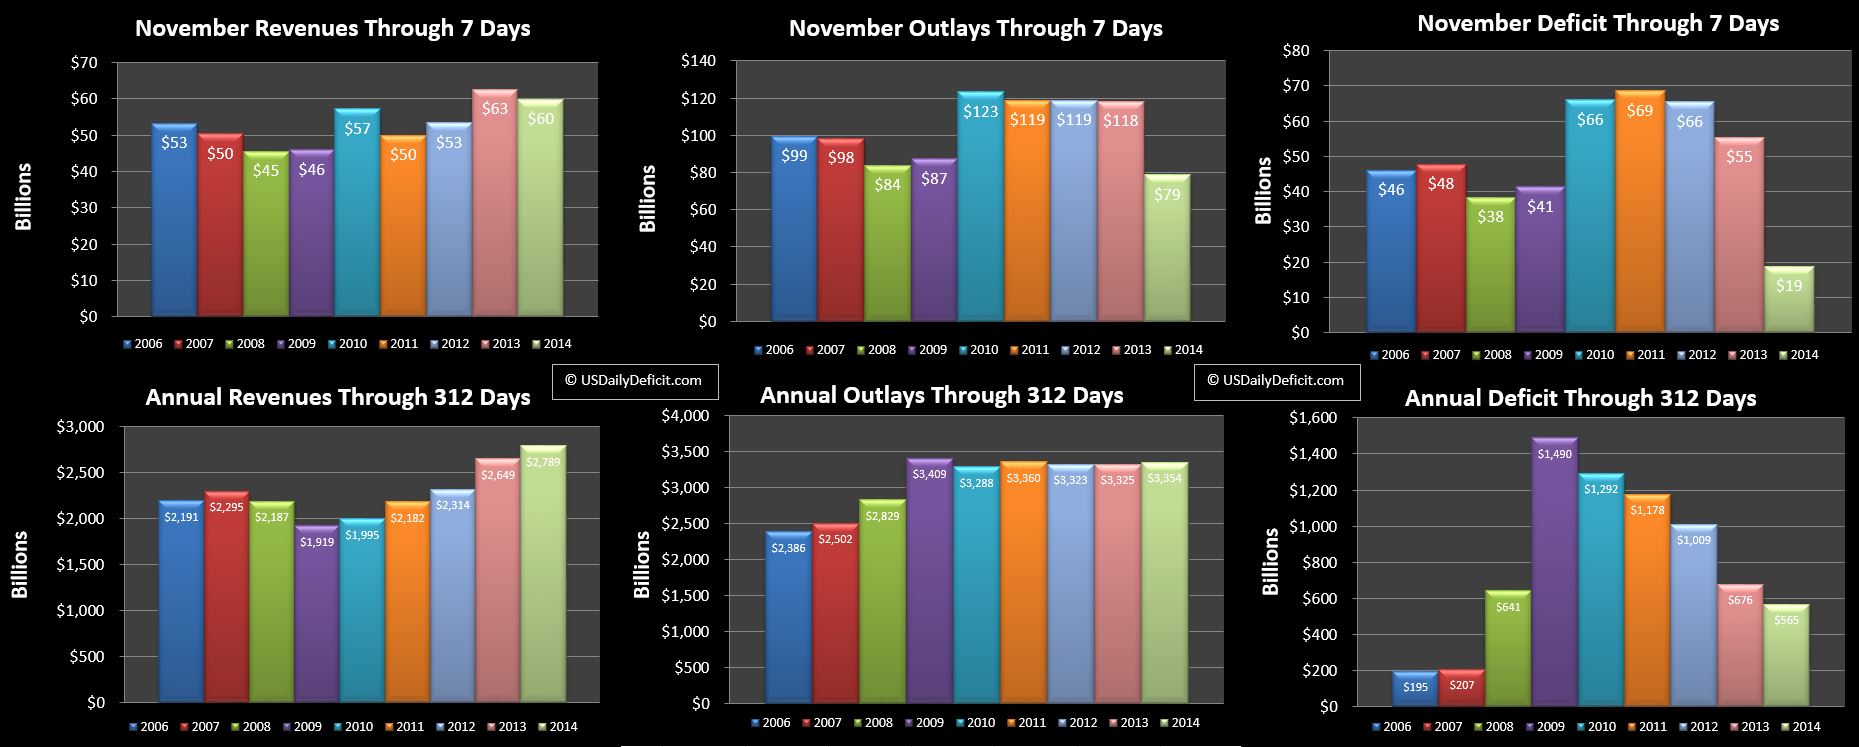
Very little YOY change on the day, so let’s take a look at our new charts….the YTD charts on the bottom. What we are doing is comparing 2006-2014 revenues, outlays, and deficit through the same number of days….in this case 295. The charts used to only go back to 2009…I’ve added in 2006-2008..interesting times if I recall.

Revenues:

Revenues are obviously on track to hit a new record, but looking back to 2006 gives us a good reference. Over the 8 year period, we look like we are averaging about 3% annual growth in revenues….though obviously there we had a large range of change…from ~-10% to the +~15% we saw in 2013. ~3% is a long term # I can believe in…moderate growth in GDP, plus population growth and inflation.

Outlays:

Our chart clearly shows the huge spike in outlays from 2008-2009, followed by going on 6 years of more or less flat outlays. I tend to think 2015 will be the year we start heading back up, but it’s not likely to be a spike…just a resumption of 2-3% growth.

Deficit:

If you pull 2006-2008 out….you could have a graphic for a democratic campaign poster….not that it would help 🙂 (contact me for licencing info…cash only please :)) This is pretty much the story of the last 8 years…a huge spike followed by annual improvement..but still at a pretty high rate. The question is…..where are we headed? Clearly if the trend continues, we’ll be deficit free in 3-5 years, but I wouldn’t bet on that horse. I’ve been wrong before, but my guess is that we are fairly close to a plateau. Over the next 12 months or so revenue gains will slow and cost pressures will mount resulting in a plateau around the $500B range (annual…charts above are through 295 days). For reference, the TTM deficit through September was at $616B. After that…it will turn around and start heading up at a moderate rate. Of course that assumes no shocks….I can’t forecast those, so I haven’t even tried. Looking back to the last recession…TTM revenues peaked in 4/2008 before falling 17% and bottoming out in 11/2009….lets hope we don’t get another one of those.