Tag

Budget Deficit

Interest Rates On Government Debt: Low And Headed…Lower??

By | Commentary

Over the last 12 months, about $220B of cash interest payments have been made on a rough average of 11.6T of external debt(Average of last 12 month ending balances)…for an estimated rate of 1.895%…not too shabby for unsecured debt.

07-15-2013 estimated interest 2007-2013

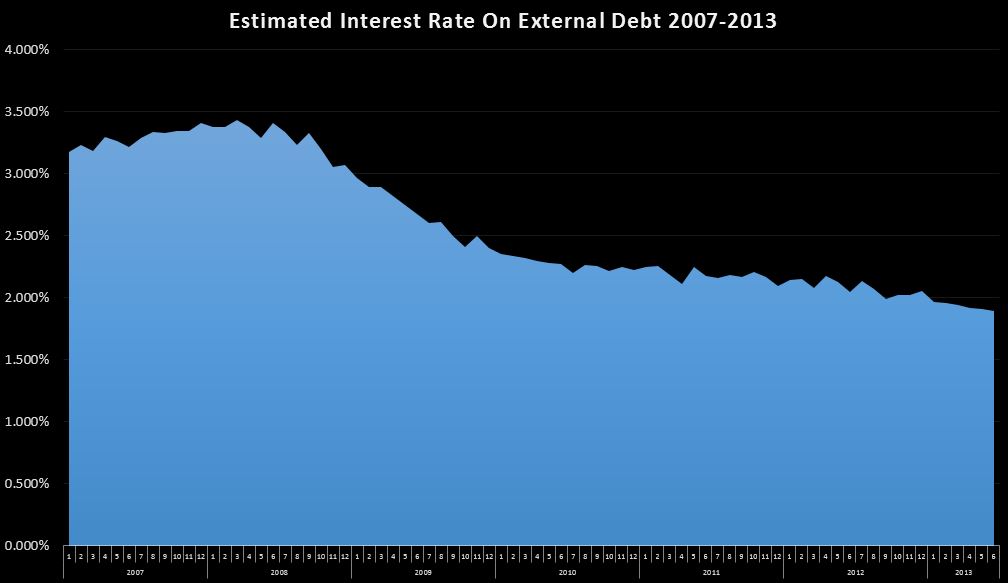
1.895% is the low point in my data series…going all the way back to 2002, and is almost certainly the lowest ever. I’ve mentioned before that this is one of the key metrics I keep an eye on because the only way we as a nation have managed to get this far is the extremely low rates. It is my hypothesis that this is the real reason the Fed has been manipulating rates so low for so long…if they ever go up…the long term deficit goes kaboom. There has been a lot of talk lately about rates going up, in fact I looked at it just a few weeks ago in Interest Rates Rising – What Does It Mean For The Deficit??

In that article, I came to the conclusion that the recent increase in rates, while not a good thing (for the deficit) it was unlikely to have any short term material impact on the deficit. A few days ago, I stumbled upon Treasuries Monthly Statement OF Public Debt (MSPD) which gives us a breakdown of the debt outstanding…by each issuance. This gave me the data I needed to take an even closer look at the internal mechanics of our debt and cash interest expenses.

So let’s first envision a scenario where the national debt is $11.6T, but that it is stable. That debt is made up of hundreds of different issues…each for a unique term, set by the market rates at the time they were issued. For all of these together, we know that the weighted average is about 1.895% at present. So as we chug along in our steady state…each month, old issues come due, so they are paid, and replaced by new issues…at current rates. If the expiring debt is a higher rate than the current rate…the weighted average will continue to decline over time.

The MSPD data set gives us the ability to see what debt is expiring, and this gives us some insight into the direction of rates…at least in the short run. So let’s look at the data. It just so happens that 3 years ago, on 7/15/2010, Treasury issued about $35B of 3 year notes at 1%. Those notes were paid yesterday. So I went over to yahoo, and it looks like the 3 year’s going rate is about 0.6% today…so theoretically…Treasury could have essentially refinanced that $35B…at nearly  half the rate. The savings are about $1.4B per year.

Another example is the 30 year bonds issued in Feb of 1985…$10.5B at 11.25%. I don’t know what rates will be in a year and a half, but there is a pretty good chance it’s way under 11.25%. If it’s not….you’ll have bigger concerns.  Obviously…this refi will lower the weighted average rate…even if it comes in higher than the 1.895%.

Just glancing at the next 12 months of expiring notes (2-10 years)…there is about $1.3T, and the vast majority of it is at higher rates than it could be rolled at today’s rates. So, while rates seem to have come up a bit off of some extremely low lows….rates are still lower than they have been historically, and this will continue to push the effective rate down…probably for at least a few more years. Rates are still extraordinarily low, and for the sake of the deficit, I expect the fed to keep them here until they no longer can. Even then… given the massive amount of debt outstanding, it will take a few years of rolling from lower rates to higher rates before we start to see material increases in interest expense. All of this of course assumes they can roll debt at any rate…which maybe a bad assumption….I know I wouldn’t loan Uncle Sam any money, but that’s just me:)

So for the time being, I fully expect the effective interest rates to continue a modest decline, roughly keeping interest paid the same, despite debt continuing to grow (at least after the debt limit hike is passed…which it will be) While interest is definitely going to be a huge problem over the long run when the fed loses control of rates and we have to start paying market on ~20T or so of unsecured debt….in the short term, it’s going to take a lot larger swing in rates than we have seen to date to make a material impact on the budget deficit.

7/11/2013 Daily US Cash Deficit

By | Daily Deficit

The US Daily Cash Deficit for 7/11/2013 was $4.9B bringing the July 2013 deficit through 11 days to $77B. Revenues are still trending low at 4% YOY gain. Next week could bring a change in fortune, as the 15th usually brings a spike in revenues….hopefully it will be enough to bring that YOY back up to 10% or so.

07-11-2013 USDD

There is one interesting data point I would like to point out…business tax refunds are up 77% from ~$1.1B to ~$1.9B compared to last year. At less than $1B, it’s really not material, just interesting. So far, gross corporate taxes recieved are down a bit, but essentially flat YOY…we’ll know by the end of next week if the refunds numbers are an ominous sign that corporate taxes are headed down, or if it is just an immaterial timing blip.

7/05/2013 Daily US Cash Deficit

By | Daily Deficit

The US Daily Cash Deficit for 7/5/2013 was $5.2B bringing the July Deficit through 5 days to $59B. Although it’s only 4 business days, we have more or less a comparable full week to 2012…Revenues are up 7%. Cost…if we add back the $30-35B to July 2012 that was actually paid in June, we are pretty close to even. It’s still too early to tell, but 7% is a healthy gain so far (better than a decrease) and I would expect to build somewhat on that…especially with one extra business day over 2012 which we would expect to add about 5% or so of revenues and cost. So…looks like same old story…flat cost  and ~+10% or so revenue gains. It’s a really good story….let’s hope it doesn’t end soon.

07-05-2013 USDD

6/27/2013 Daily US Cash Deficit

By | Daily Deficit

The US Daily Cash Deficit for 6/27/2013 was $7.0B dropping the June 2013 Surplus down to $51B with 1 day left.

06-27-2013 USDD

Tomorrow is going to be polluted with the extra 2012 payments and the Fannie Mae Funny Money in 2013, so this may be the cleanest shot we get at the fundamentals. So from this year’s 51B surplus, I would just subtract the $35B timing benefit to get down to $16B Surplus, a $42B improvement over last year. Not bad at all really. The real question is….what are we going to see next January. In theory, given constant rates, revenues should roughly grow in line with GDP and population growth…so maybe a few percent. If we are posting sub 5% YOY growth next year, lookout!!

Did Bernanke Really Lose $151B???

By | Commentary

I read Bernanke’s bond losses: $151 billion plus over at money.com with great interest. It has a sensational title, but ultimately comes clean with a solid conclusion…these are just paper losses. It’s a good article…just make sure you read it all the way through:)

So…for a primer, here is how it all works. First, the Fed, using it’s magic wand, creates new/fake money. Then, they go out into the market, and use that money to purchase bonds… $1.9T of treasuries and $1.1T of mortgage bonds according to the article. This is more or less “quantitative easing”

So say I’m a saver, and I just purchased a shiny new $100 30 year treasury bond with a 2% yield. I paid $100, and am really looking forward to getting my $1 check in the mail every six months. Then I get a call from Uncle Ben (Bernanke). “Say….if you want to sell me that bond…I’d be happy to buy it for $101”. So I say ok….take my $1 gain, and replace it with another newly issued bond…this time at 1.99%. Rinse Repeat a few million times. Now…of course Ben’s not really going to call me up with a $1 treat….but his banking buddies…you bet!!

So now Ben has managed to take his imaginary money and push it into the real economy…lowering rates, making his banking buddies rich…maybe even creating a job or two for the Bugatti plant.

Every six months, Treasury cuts him a check for $1…he pays his staff, and sends the rest right back to the federal coffers….where they book it as revenue under “Federal Reserve Earnings”

Got that? Federal reserve creates imaginary money and uses it to finance the federal government (after running it through a third party),. Then, the federal government sends the Fed their interest due….and the Fed turns right around and sends it back as revenue. Hooray for government accounting!!

So, lets just cut through the crap….what is really happening is the Fed is printing money and using it to finance the deficit and lower the interest rates paid by the government. The end.

Moving on….What has happened recently is that interest rates have risen on the fear that the Fed will not only stop the money printing, but also start selling the $1.9T they have accumulated. The problem, of course, is…who has $1.9T to lend to Uncle Sam?? Not me…not for that deadbeat, and surely not at 2%!!

So now Ben has my old $100 30 year bond paying $2 per year. but nobody is willing to pay him the $101 he paid, or even $100, or $98 because I can buy a brand new one paying say $3 of interest per year….for $100. In order to get the same 3% yield I could get with a new bond….all I am willing to pay for the old bond is $67….good for a $34 loss if Ben wants to sell it back to me. Obviously, I more or less made up the numbers for simplicity and to make a point, but these mechanics are how the authors of the story came up with the $151B paper loss. I’m sure their math is right, but as the article mentions, these are paper only losses, and the Fed doesn’t have to actually recognize them until they sell their $101 bond for $67. They could hold them all to maturity and never book a loss. Now, I have a lot of problems with this entire program, but not with this.

Say I agree to loan a friend $100 at 5%. A week later, interest rates have doubled to 10%. While one could argue that had I waited a week I would have got a better rate and made more money….I shouldn’t have to write down the value of an asset just because I  kinda sorta maybe missed out on a higher rate. If rates drop, I shouldn’t write up the value either. I understand the arguments for….just the very idea of constantly marking assets up and down based on market whims kinda grinds at my accounting core….which yearns for stability. If my company purchases a work truck for 40k….and a shortage of trucks creates a surge in the market value of trucks….doubling it to $80k….I don’t write the value up and recognize a $40k gain….I recognize the gain or loss only if I actually sell the vehicle.

Moving on again…I know this is getting long. How does all this affect the deficit. First, QE enables the deficit…making the money available in the first place, at a lower  (manipulated)interest rate, and even lower rate still once you net out the interest paid to the fed and remitted back….and that’s the part I want to finish on. Looking Back to 2007, the fed was contributing about $30B per year to federal coffers. This spiked all the way to an $87B per year rate by mid 2011, but has since slid down a bit to about $78B… as revenue, this is a direct reduction in the deficit…if it went away tomorrow, our annual deficit over the next 12 months would be $78B higher.

This, it seems to me, is the risk to the cash deficit. First…If these losses are recognized…even if over many years, one would think that this would result in a further decrease to these payments. Say they dropped $50B….that’s a new $50B hole….in perpetuity. Second…even if there were no losses…should the Fed ever start selling these and winding down their $3T portfolio…that would slow the payments anyway…probably back down to the $30B or so we saw back in 2007….and that is ignoring any losses they incurred along the way.

In my own forecast, I have this revenue continuing indefinitely, growing at a 3% pace. from 2014 on. I have it there because I do not believe at this time that the fed can ever unwind it’s $3T portfolio of imaginary money without blowing up the entire economy….in fact it will probably continue to grow, since there is nobody else with the ability to absorb the $12T or so of additional debt the US will need to issue over the next 10 years (assuming we make it that far). So…while I acknowledge the “revenue” associated with these cash payments from the Fed now appear to be in Jeopardy, I am not quite convinced the Fed can or will ever actually start unloading it’s $3T portfolio. That said…I’ll keep watching because you never know when something crazy might happen.