Monthly Archives

July 2013

7/25/2013 Daily US Cash Deficit

By | Commentary

The Daily US Cash Deficit for 7/25/2013 was $6.6B bringing the July 2013 deficit through 25 days to $97B with four business days remaining. I had expected to see some $4B in revenues from the states related to unemployment but it did not come through today. When it does, it should help trim a bit off the deficit. At the beginning of the month…I estimated the ending deficit at $80B. Getting $17B of surplus over the next 4 days is probably going to be a stretch, but stranger things have happened.

07-25-2013 USDD


7/24/2013 Daily US Cash Deficit

By | Daily Deficit

The US Daily Cash Deficit for 7/24/2013 was $9.9B pushing the July 2013 deficit through 24 days to $90B with five business days remaining. After several weeks of pulling away from 2012, 7/24 delivers an apparent 5B setback to revenue bumping us back down to 4% YOY growth. However, after further investigation, I suspect most of this is due to small timing differences…a ~4B deposit from the states is likely to come through tomorrow should put us right back up around 7-8%.

07-24-2013 USDD

So…with a week remaining, we are at $90B. I could see this going +/-$10B from here with the big unknown being the extra day…next Wednesday. Typically, Wednesdays have pretty solid revenue numbers, but the large SS payments that go out in week 2-4 on Wednesdays typically make it a big deficit day. So outlays should run at reduced levels, but revenue…I am not sure.

Cash:

Cash in hand, at $51B is looking a bit light to make it through August…which will probably run a $125B-$150B deficit. Can Treasury pull $100B out of their magic hat??? Sure…why not?? They’ve done it before…it would be a bit naïve of me to assume otherwise….but still, I can’t help but watch…just in case something crazy happens. Even if they make it through August, they have to squeak by the first two weeks of September before revenue really starts pouring in….then October comes on strong with another nearly $100B deficit.

July 2013 Update : Social Security-Annual Change In Retired Workers

By | Commentary

The Official July Social Security update was released this morning so I thought I’d take a look and give an update…here is my June update if you missed it.

07-25-2013 Social Security TTM

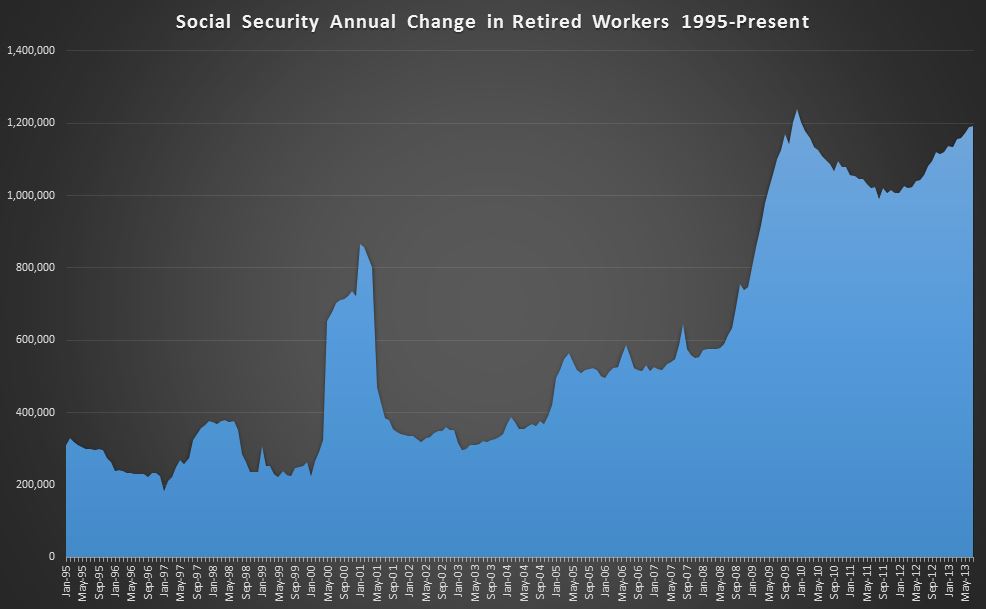
The chart is largely unchanged. For July, we added 112k new retired workers to the population…I don’t have the data to confirm this, but generally…you are looking at about 300k new enrollees, being offset by ~200k deaths. Also note that additions seem to be driven seasonally with Jan being the highest month at +171k this year, and December being the lowest…59k in 12/2012. I don’t know if this is driven by retirement patterns or death rate patterns, I suppose it doesn’t really matter.

What we are really looking at then…is to compare July 2013 to July 2012. It turns out they are nearly identical…July 2012 had 110k of additions, so less than a 2% increase. This very may well be an anomaly…the last 4 months have averaged almost 17% YOY gains. With minimal YOY change…our TTM…charted above rises the 2k…from an annual rate of +1.190M to +1.192M

The average benefit rose $0.86 from $1269.38 to 1268.52. This sounds inconsequential, but it suggests to me that new retirees are on average coming in with higher monthly benefits, as much as $300 higher than the beneficiaries that are passing away. This could be driven largely by narrowing of the gender gap…both in labor force participation and pay. So just imagine that in a given month, a 95 year old female beneficiary passes, and a 65 year old female  applies for benefits. With 30 years between them….they likely have very different work histories….and very different $ benefits. In this scenario, even though the count stays the same, the average could go up quite a bit. In the long run, we can likely expect the current $300 gender gap ($1425-male $1111-female) to close, and perhaps even reverse itself…and while this may be a good thing for society….it will add additional strain to social security. If the gap were eliminated today….monthly benefits would jump nearly$6B…$70B per year (or $700B over ten….which is how congress likes to digest it’s data)…all of course added directly to the deficit.

So bottom line, we are currently adding a net of nearly 1.2M people to the social security retirement rolls per year, a trend that should start ramping up over the next five years as we get into the meat of the boomers. This may be a slow motion trainwreck, but the end result is going to be just as ugly.

7/23/2013 Daily US Cash Deficit

By | Daily Deficit

The US Daily Cash Deficit for 7/23/2013 was $2.7B bringing the July 2013 deficit through 23 days to $80B with six business days remaining.

07-23-2013 USDD

I think it is worth noting that 2013 is now within $10B of last year, despite a $35B head start due to the timing of outlays…if you recall, about $35B of July 2012 outlays due the first went out in late June because of how the weekend fell. So, in reality, we have about a $25B improvement so far…$11B on the revenue side and about $14B of reduced outlays. Is the Sequester actually working??

Of the reduced outlays, two stick out…Defense Vendor Payments through the same number of business days in July2012 were ~$26B. 2013…only $18B, a 30%  and $8B reduction. Education Dept. Programs, whatever that is, was $12B last year…6.5B in 2013… a 45% reduction with about a week left. The only big event remaining this month is the final Social Security payment which went out today at ~12B that should cause a ~$5-$10B deficit when it shows up in tomorrow’s report. The remaining days should be +/- a few $B…more or less cancelling each other out absent some surprises.