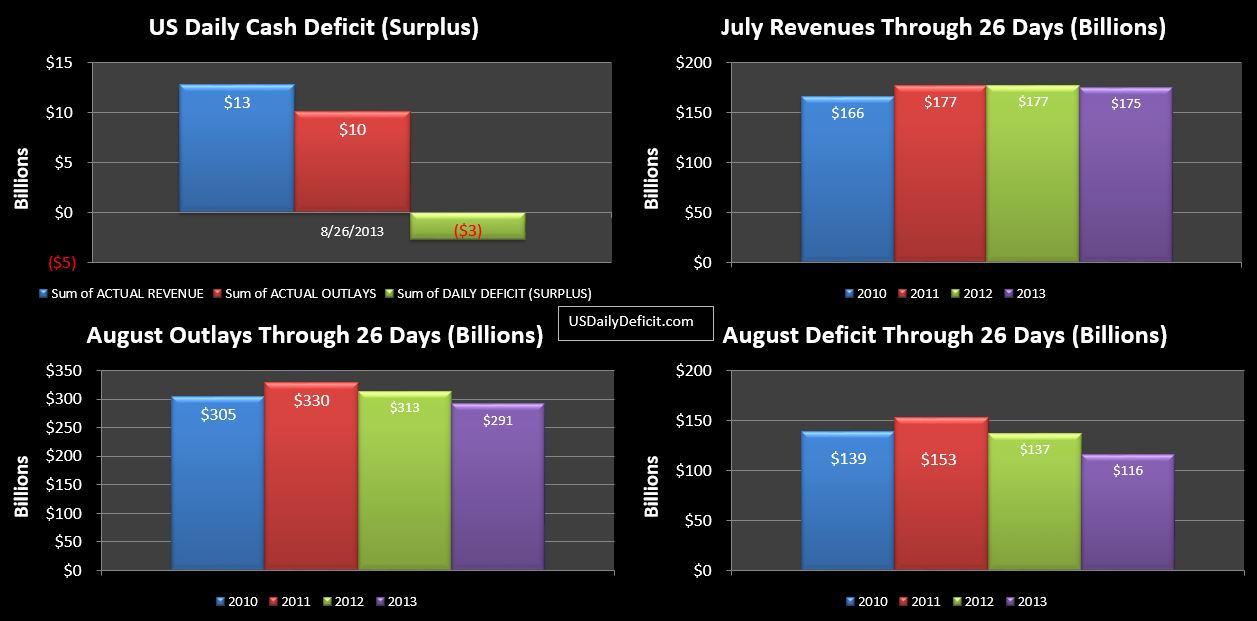
The US Daily Cash Surplus for 8/26/2013 was $2.7B bringing the August deficit through 26 days to $116B with four business days remaining. My original deficit estimate was $155B, and we are certainly within striking distance. We need $39B to get there. Tuesday-Thursday will likely average around $5B per day….meaning a 24B deficit on Friday would get us there. For reference…the deficit on Friday 8/31/2012 was $64B…but it included $23B of Social Security payments slated for 9/3/2012…Labor Day. This year, Labor Day is on 9/2, so the 9/3 payments of about $25B should go out in September…rather than being drawn into August like in 2012. So…absent surprises, the August Deficit is looking to end around $155B to $170B or so.
Cash in hand is now down to $42B…less than the expected cash deficit over the next four days…..which of course means Lew will need to use his “extraordinary measures” (EM) to create some cash out of thin air. While there are multiple elements to EM, the accounting is straight forward. They simply pretend that some of the existing debt does not exist…which lowers the official debt outstanding…allowing them to issue more debt in exchange for cash….and thus keep funding the government despite the debt limit. Yes it’s shady…it basically changes the debt limit to… debt limit +$300B or so. Last time we had an extended debt limit fight like this was between May 2011 and August 2011. The day after the debt limit was raised…debt outstanding increased $239B…as the Treasury made the necessary journal entries to make all the outstanding “EM” show back up on the balance sheet.
The latest from Lew is that the “for real” debt limit will be hit in Mid October. So…lets back into that. We started playing this little game back on 5/20 with a cash balance of $34B. For the remainder of May, we ran a $58B deficit, followed by a $116B surplus in June thanks mostly to our buddies at Fannie Mae coming through on our payday loan. then came July with a $90B deficit, and through 26 days of August, we have another $116B on the books. Add it all up, and absent EM, we would have a cash balance of about $-114B instead of the +42B we actually have, indicating EM to date of about $156B…
I recall reading somewhere that extraordinary measures gave them $260B of headroom….indicating that they have about $100B left. Lets say we run another $50B over the next 4 days…we end August with 50B of EM in the tank, and $42B of cash (or some combination of the two)…$92B. After a weak start, September should recover as revenues start pouring in mid-month as quarter ends usually do…My preliminary estimate for September is a $60B surplus…pushing the $92B cushion up to $152B by the end of September. From there…I have the October Deficit at $97B and the November Deficit at $130B. So with this set of facts and assumptions…I would put it at early to mid November versus Lew’s mid October. That said…any errors in these values would push the date forward or backward. For example…if the true amount of EM left is only $50B, and my October deficit forecast is $20B low…I could see a mid October date, and honestly, I have no reason to think my simple model is in any way superior than Lew…who likely has far superior data and a crack team of government analysts updating the forecast hourly.
In the end, I suppose it really doesn’t matter what the date is. The big picture is this… We have $17T of debt, and while the 2013 deficit will show a material improvement over 2012 (down from $1.1T to ~$750B)…this is likely a bottom…with steady increases from here on out.
Interesting fact…the distribution of the deficit over the fiscal year has become extremely asymmetrical…which is what has enabled the Treasury to draw this debt limit battle out all summer and apparently into fall. Using actuals for FY 2013+ estimates for August and September, it looks to me like a full 85% of the deficit will have been incurred in the first half…October 2012-March 2013. We are still looking at huge deficits…in the $700-800B range, but they are not evenly distributed…making it easy to skate by on EM during the second half of the fiscal year. So…when you hear all those amazing stories about the debt outstanding being the same for 100+ days…when you look at the detail…it’s really not that amazing. Shady…yes, but completely explainable 🙂