Tag

US debt

Daily US Deficit For 11/15/2012

By | Daily Deficit, Debt Limit, Fiscal Cliff

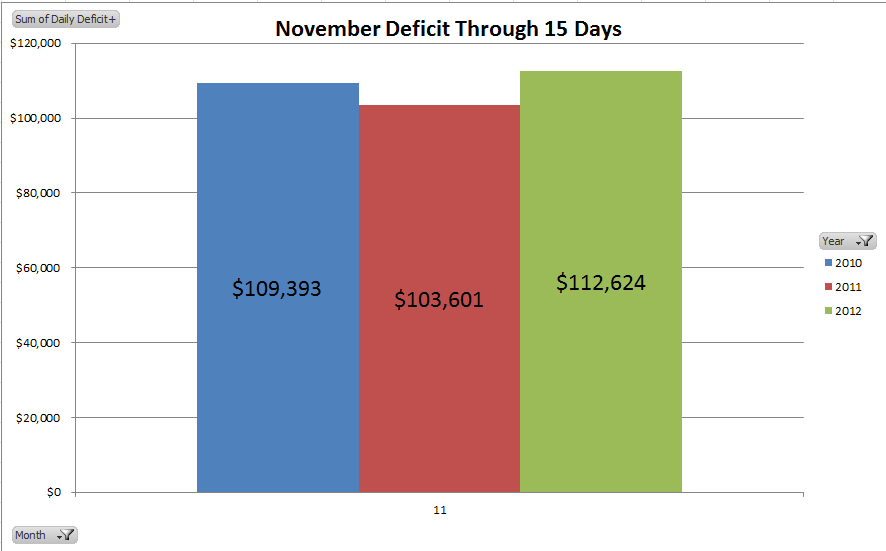
The US Daily Deficit for 11/15/2012 was $30.9B on revenues of $12.6B and spending of $43.5B. The primary driver was interest expense totaling $29.9B. Remember… we are using cash accounting here, so we catch these interest payments when the cash goes out the door, unlike accrual accounting, where you would be recognizing the interest expense as it was incurred. Halfway through November, our deficit is running about $9B over last year. Last year, the total deficit was 142B for the full month. Since we are pretty much on track with last year, I’ll stick to that, and add an adjustment of $28B for a wild guess of $170B deficit for November 2012. Most of this adjustment is to account for December SSI payments that will go out 11/30 this year since 12/1 is on a weekend, the rest is just a plug to get me to a round number.


Daily US Deficit For 11/13/2012

By | Daily Deficit, Debt Limit, Fiscal Cliff

For 11/13/2012 the US government ran a surplus of $1.0B on revenue of $12.8B and 11.8B of expense. Don’t expect this to carry into tomorrow though. Social Security benefits go out the second, third, and fourth Wednesday’s of the month, so tomorrow’s report will likely have us at a $10-$15B daily deficit for 11/14. Quick math…that’s almost $50 per person in the United States….$250 for a family of 5. Yikes!! Maybe I should eat in tonight 🙂

Daily Deficit for 11/9/2012

By | Daily Deficit, Debt Limit, Fiscal Cliff

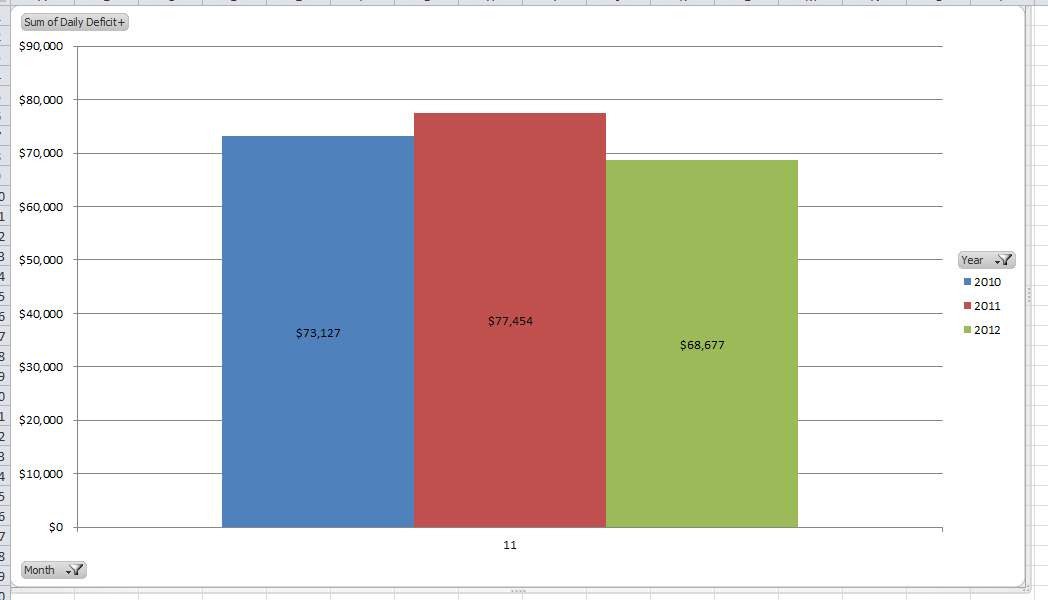
Just a note, the DTS are typically released the following business day at 4PM EST. The deficit for last Friday, 11/9 was $4.8B on revenue of $5.3B and spending of $10.0B. Yes..these are rounded. Here’s how the month is looking through 9 days:

Through 9 days, the November deficit is $68.7B, an $8.8B improvement over 2011. Don’t get too excited yet. Revenue and cost are highly variable, and fluctuate depending on the day of the week and payment schedules.

What The H Happened?

By | Fiscal Cliff

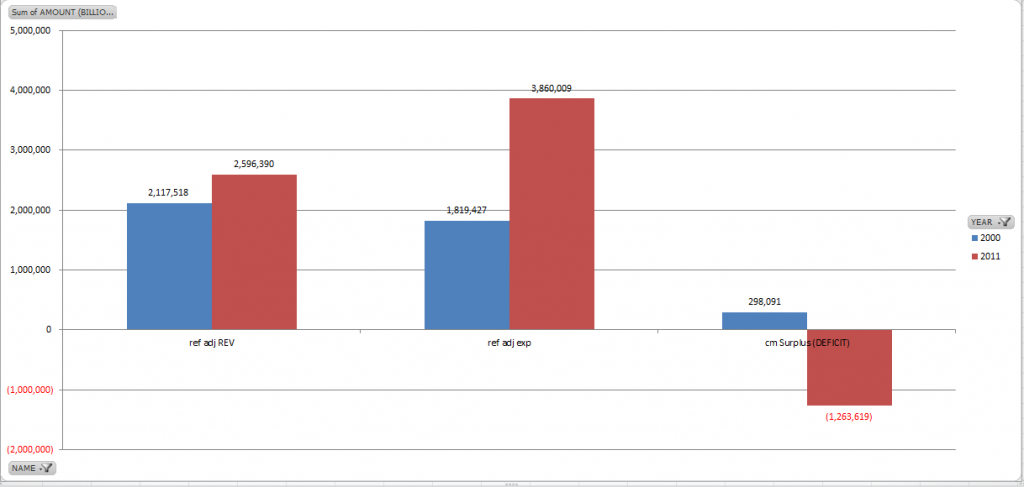
In 2000, the national debt was $5.7T and actually dropping. As I write this, the debt is $16.2T, and increasing at about $1.2T per year. What happened? How did we get here and where does it look like we are headed? The Daily treasury Statement (DTS) gives us the data we need to dig in and figure it out. The chart below shows us Revenue, Expenses, and Deficit (CASH) for 2000 and 2011

It’s not really too hard to spot the problem.

Revenue has increased from $2.1T per year to $2.6T, a 23% increase. Spending…on the other hand, goes from $1.8T to nearly $3.9T…more than a clean double. For reference, population increased about 10% over this time period. Those are the facts.

So think about that. We are running about a $1.2T annual deficit. Regarding the upcoming “Fiscal Cliff” the spending cuts on the table don’t even add up to $100B per year. If we, as a nation can’t even fathom a 2.5% cut to federal spening in a given year, it’s quite clear that we aren’t not even close to being serious about this. At this point in time, I can’t even envision a good outcome. I’ll go ahead and say it….this debt will never be repaid.

Calculating the Daily Deficit

By | Methodology

When we talk deficit here at the Daily Deficit….we are talking about cash. Simply…cash in less cash out. If I take in $5B in taxes, and spend $10B…my daily deficit was $5B. We make two notable adjustments to the DTS totals. We start with total cash in, then we subtract cash in from issuing debt. This makes sense. Issuing $100B in new bonds increases cash, and debt by $100B. It has no effect on the deficit…it’s a pure balance sheet transaction. We do the same on the other side of the equation by removing cash outflows used to pay down debt, or pay off expiring bonds. This gets us down to revenue in from taxes and other sources, less cash out from expenditures. We then make one final adjustment. The DTS shows tax refunds on the expenditure side. As an accountant, that makes me cringe a little bit. I believe that tax refunds should be accounted for as a reduction in revenue, not an expense, so we take daily tax refunds and reduce cost by that amount, as well as revenue. If we don’t do this, we would essentially overstate revenue and cost by about $400B per year.

So, lets take a look at 11/8 and pencil out a quick example. Per the DTS:

Total Deposits   ($131.251B) – Debt Issues ($127.671B) – Tax Refunds ($0.131B) = $3.449B of Revenue

Total Withdrawals ($110.529B) – Debt Redemptions ($110.529B) – Tax Refunds ($0.131B) = $9.169B od Cost

Then, we do the math…$3.449B – 9.169B = $-5.720B

So our daily deficit is $5.72B. Yikes!! How much money did you lose 11/8?