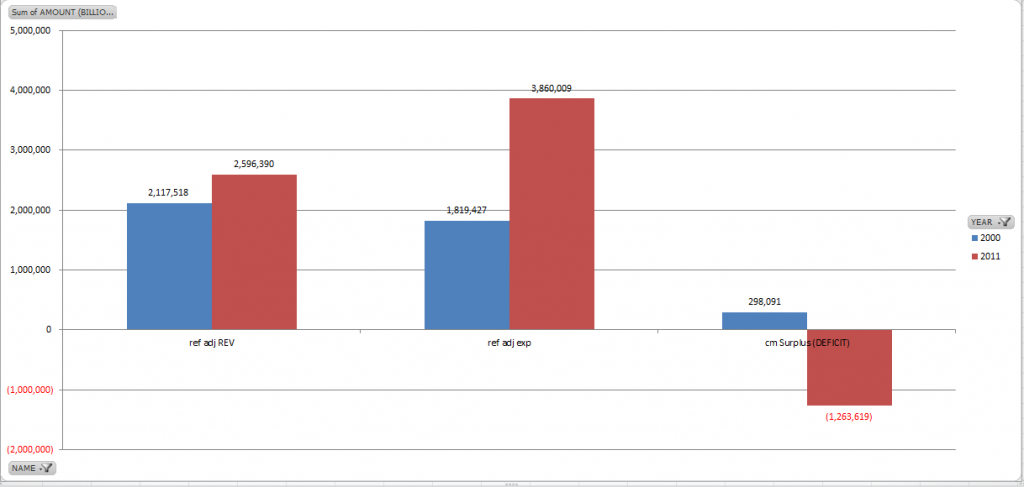
In 2000, the national debt was $5.7T and actually dropping. As I write this, the debt is $16.2T, and increasing at about $1.2T per year. What happened? How did we get here and where does it look like we are headed? The Daily treasury Statement (DTS) gives us the data we need to dig in and figure it out. The chart below shows us Revenue, Expenses, and Deficit (CASH) for 2000 and 2011
It’s not really too hard to spot the problem.
Revenue has increased from $2.1T per year to $2.6T, a 23% increase. Spending…on the other hand, goes from $1.8T to nearly $3.9T…more than a clean double. For reference, population increased about 10% over this time period. Those are the facts.
So think about that. We are running about a $1.2T annual deficit. Regarding the upcoming “Fiscal Cliff” the spending cuts on the table don’t even add up to $100B per year. If we, as a nation can’t even fathom a 2.5% cut to federal spening in a given year, it’s quite clear that we aren’t not even close to being serious about this. At this point in time, I can’t even envision a good outcome. I’ll go ahead and say it….this debt will never be repaid.
