First…a recap….
When we last left off…we were seeing a pretty nasty trend….thanks in part to tax cuts and spending increases… for the May-July time frame we were looking at a 7% YOY decrease in revenues and a 7% increase in YOY spending….
So…let’s catch up by looking at August and September.
August:
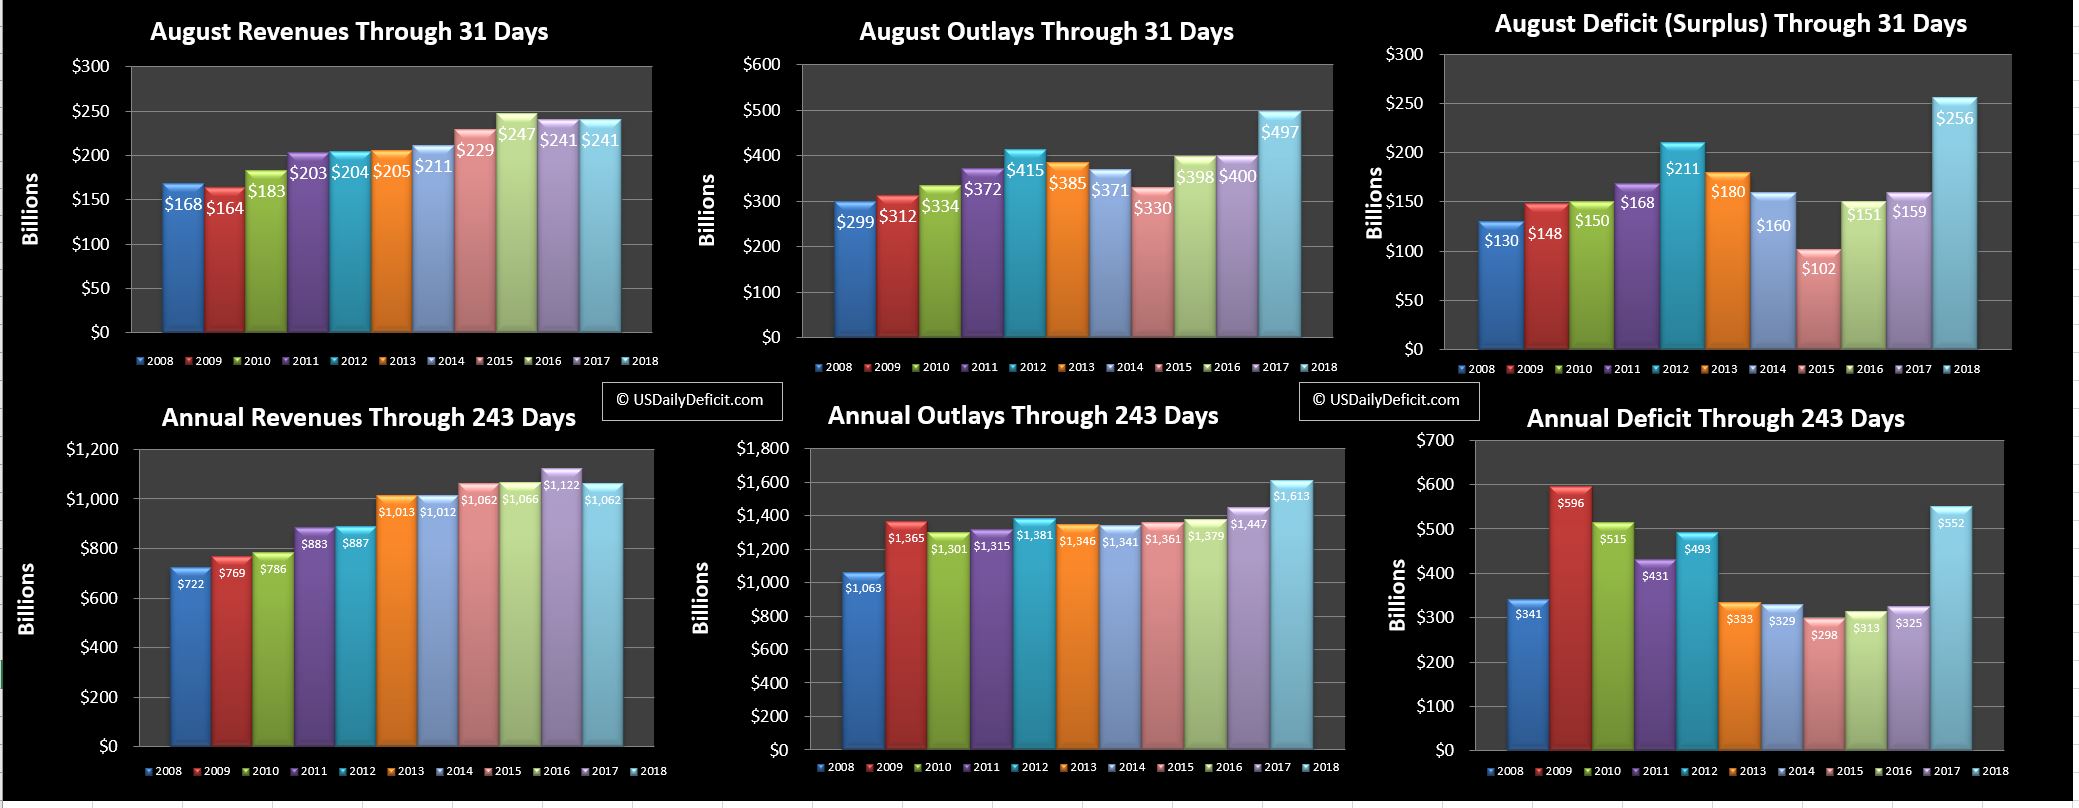
August revenues were flat….not great but way better than -7%. Outlays were off the charts….but a big chunk of that was timing…with September 1 being a Saturday, and September 3 being a holiday…a huge slug of costs that normally would have been paid in September got pulled forward and were paid 8/31. Augusts burden will become Septembers gain….remember that for below. The result is predictable… a 256B deficit…$97B higher than last year….but will it stick?
September:
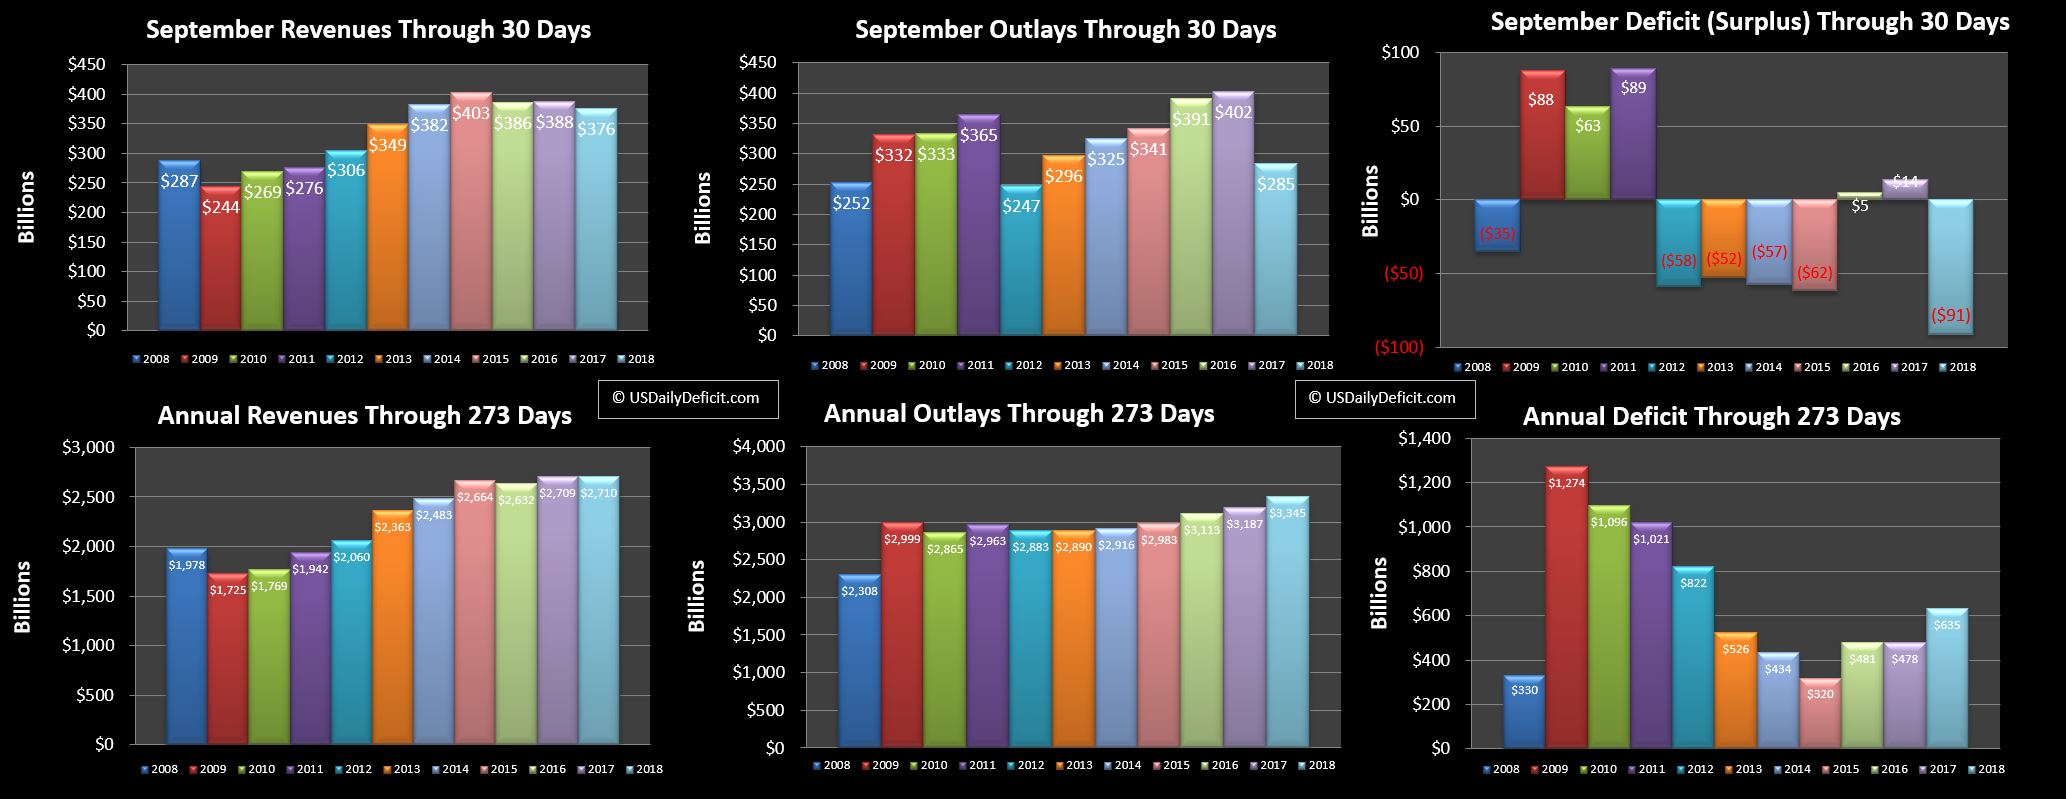
Revenues for September were down 3% not good, but still better than -7%. As expected….outlays are way down….about $100B of cost due in September was paid 8/31…pushing up August’s deficit and down September to a $91B surplus. In fact, we actually have a timing event going the other way for our YOY…September 2017 had some October cost pulled forward…this September did not have that issue…but no worries…by the end of October we should be more or less back to even….at least for the YTD.
Combining August and September together to kind of wash out the 100B swings…we have revenue down about 2% and cost down about 3%…though again…timing. So…let’s have another look at May-September…we see revenues are now down just 5% compared to 7% for May-Jul, and costs are up just 3%, compared to +7% for May-Jul.
So…bad, but not as bad. No real shocks in these numbers….those +/- 7% were unlikely to hold up for the full year…and should more or less reset next May anyway…but the bad news is still with us…the deficit is trending up…it was $700B for 2017 and is zeroing in on $900B for 2018…with the trailing 12 month probably topping $1T in April 2019. For a history lesson…we dropped under $1T back in 2013…bottoming out at $458B in January of 2016. How long can this go on? I’ve given up guessing that, but we are clearly way past the point of no return. Interest rates are rising, Boomers are retiring, revenue is stagnating, and as soon as we get even a moderate recession….$1T will go to $2T in the blink of an eye. From here on out…it’s really just watching the Titanic go down…sad, but inevitable. Oh well…we might as well enjoy the band while it’s still playing.