The US Daily Cash Surplus for Friday 10/4/2013 was $4.5B pulling the October 2013 Deficit through 4 days down to $50B. Cash Outlays were extraordinarily low…coming in at only $5.7B….. you have to go back all the way to May 2011 for a lower daily number. Not sure if that’s an anomaly, or somehow related to the “shutdown”…maybe the accounts payable group was deemed non-essential….thus, thus slowing down the payment process? Or maybe they are just slow paying to conserve cash…businesses do it all the time, why not Uncle Sam?
To the Charts: Full disclosure…I decided to go ahead and sync up October 2012 to 2013. October 2012 started on a Monday, October 2013 started on a Tuesday. Since revenues and outlays are generally correlated with the day of the week, I will just go ahead and add the extra day in 2012 into our charts. For example, today, we will be comparing 4 business days of 2013 (10/1 to 10/4) to 5 business days of 2012 (10/1 to 10/5) both ending on a Friday. 2013 will catch up on the last day of the month. Granted, this isn’t a perfect YOY comparison, but perfect simply doesn’t exist.
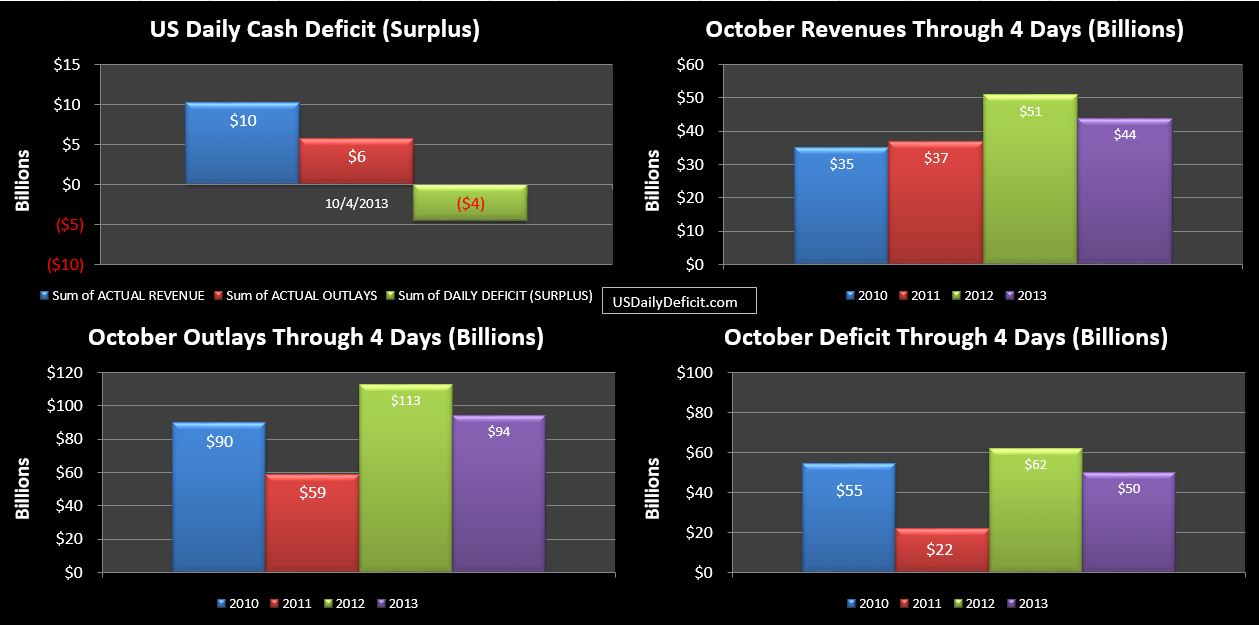
Revenues are down still but making some progress in catching up to 2012, while cost is looking really good….almost suspiciously good as noted above. Cash in hand grew about $4.5B on the surplus and is currently sitting at $29B…right about where Treasury is saying it will be on 10/17. I would expect to post another surplus Monday 10/7, before slipping back into deficits 10/8-10. Again…nothing big for the rest of the month, just moderate weekly deficits slowly whittling down the cash balance. I would note there is likely a bit of “EM” magic left to play…I guess we’ll find out soon enough.