I have been wanting to try out the new release of Office, so when I found out I could get it for $10 through Microsoft’s Home Use Program, I decided to skip lunch and take it for a spin. At first glance, it is not very visually appealing compared to Excel 2010. Microsoft says it looks “clean”. I think it looks ancient. In fact, it reminds me a lot of excel 2000, which I had the unfortunate pleasure of playing with about six months ago. (we’ve come a long way) So immediately, I am thinking…I don’t like it. To be fair, this is a spreadsheet, not a luxury sedan, looks should be irrelevant, but remember…this is my first impression…what I am thinking when I open it up for the first time.
Some installation notes….after signing up and paying, they send you a link. You click on the link, and it automatically starts downloading a 500+mb file. I was expecting a wizard…and at some point to be asked if I wanted the 32 bit version or the 64. I wanted the 64, but am pretty sure 32 was installed, which isn’t a huge problem, at least not for now. Also, I had expected it to uninstall 2010….it did not. That turns out to be a blessing, since I can still use 2010 until I am satisfied 2013 is going to be worth learning. It did do one neat thing…it pulled all of my quick access toolbar icons from 2010 and put them in 2013…saving me about 10 minutes digging through the thousands of available oddly names links to get the 25 or so I really need.
So moving on…we already know it looks primitive and somehow I managed to install the wrong version…how does it work? Well…it’s a lot like 2010, but supposedly with a lot more bells and whistles. I read through Microsoft’s brochure, and nothing really jumped out at me as particularly useful, but you never know. Odds are, I’ll find a few neat tricks here and there over the next few weeks…in the meantime, I do have one more complaint. I use a lot of pivot tables, and in 2010, when you get to the “Pivot Chart Tools” menu, it has 4 options. Design Layout Format, and Analyze. 2013 is missing the Layout option, which has shortcuts to a ton of pivot table features that otherwise require a lot of clicks in the right spot to get too…I use it a lot, and it’s gone…so that kind of sucks. Maybe I’ll find them somewhere else?? For now, since I have the option, I will probably continue using excel 2010 for all of the analysis and charts I create for the blog….
If you recall, my first thoughts on Windows 8 were that I despised it…so this is a step in the right direction. Seriously though…it looks like crap…I can’t emphasize that enough.
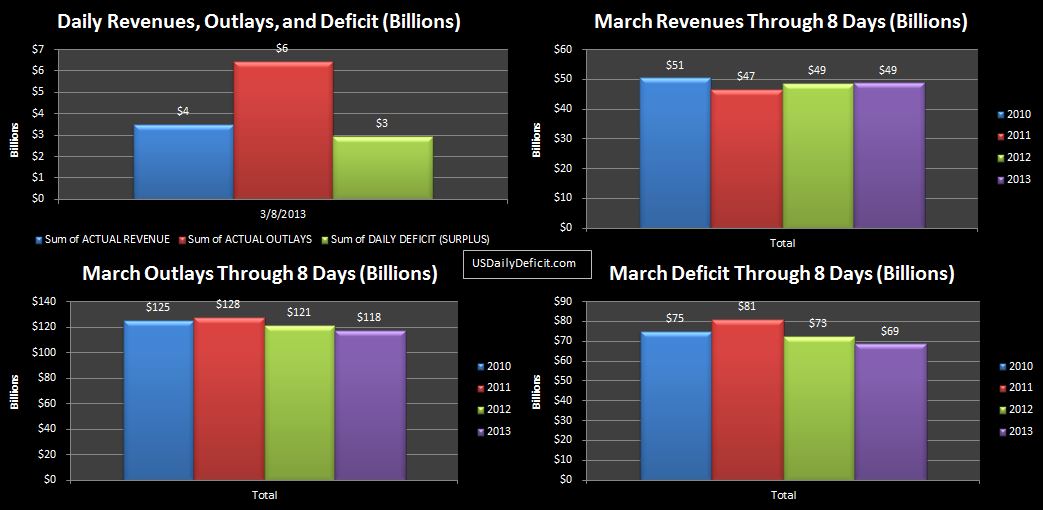
The US Cash Deficit for 3/8/2013 was $3.0B, bringing the March Deficit through 8 days to $69B.
No material breakout on either revenues or costs yet, 3/2013 looks a whole lot like 3/2012 so far. Corporate income taxes come due the 15th, which will provide a spike in revenues in the $30B range…the YOY comparison will provide an interesting gauge for what kind of revenue growth we are seeing. Also interesting, last year, on 3/12/2012, we received a $10B payment of GSE MBS Purchase Program Income. I don’t know exactly what that was, but it would not surprise me if we don’t see it this year. If we don’t, it is going to put a $10B dent in revenues and wipe out about half of the revenue gains we are expecting from the tax increases. $139B is still looking like a valid deficit forecast for now, I’d say +/-20B, but leaning to – due to some end of month timing issues I had overlooked in the initial forecast.
It seems that the Republicans have just come out with a great new plan to balance the budget in 10 years…. That’s great…I mean, why hasn’t anybody thought of this before…am I right? You can find it here. I haven’t read it all, and don’t plan too, but I did take a look at the CBO summary table, and compared it to the CBO’s own forecast released a few weeks ago, and my own forecast, which I have been working on , but not released…yet.
First, I need to provide some background about the poor bastards at the CBO (Congressional Budget Office). You might think that the CBO’s job is to create realistic models that forecast future revenues and outlay’s… you would be wrong…at least on the realistic part. You see, congress comes to them, and says…build a model…but use this list of ridiculous assumptions guaranteed to get to the numbers I want. The truth is any jackass can plug some numbers into a spreadsheet and squeeze the assumptions to force fit whatever output he wants, but that’s not called forecasting, it’s just called fiction.
The first thing that jumps out of both the CBO’s forecast, and the “Path to Prosperity” forecast is that the revenue numbers are completely bogus. For some reference, let’s take a trip down memory lane to 2003. If I know that 2002 had $1.89T of revenues….what would have I forecasted revenues 10 years out to be in 2012? To nail it, I would have needed to forecast revenue growth just a little bit under 4% per year, ending 2012 at $2.755T $865B higher. From 2002 to 2012, revenues grew by about 46%
Now, sitting in 2013, what do you think would be a good estimate for 2022 revenues knowing that 2012 was $2.755T? Paul Ryan’s plan predicts 88% growth…the CBO’s baseline forecast has it at over 93%. For some reason, they think that government revenues will grow at over twice the rate in the next 10 years as they did in the last 10? Are they optimists? Or are they just full of it? My own analysis…and realize this is one guy with a few hours a week, an ornery computer, and a ruler…I put it at 53%, and that rather than the budget being balanced in 10 years, will be pushing close to a $2T annual deficit.
On the cost side, from 2002 to 2012, outlays grew 75%. Per the Ryan plan…2012 to 2022 will only grow by 35%…despite what are sure to be massive increases in entitlements. I put it at 59%. The Ryan plan has federal outlays in 2022 at $4.888T. The CBO baseline has it $800B higher at $5.691T. I have it at $6.115T. So I guess this is a step in the right direction…but I don’t see it happening. The sequester was an $85B reduction in spending, and people had fits. The only way $1.2T of annual cuts happens is when the money runs out, which is almost certain to happen before 2022 anyway.
Look, I like Paul Ryan because he seems to be the only guy trying, and the only guy who has tried at all in the last 15 years to address this issue. But coming up with a grand plan…and using a ton of bogus, or at least unlikely assumptions to hit your number…that’s the game that got us here in the first place.
As for results…We all know that little to nothing will come of this. You can’t start negotiations with the President by presenting a budget where the first assumption is to repeal Obamacare…tomorrow… Really?? That’s even more asinine than the revenue growth assumptions Regardless of what you think about Obamacare, the truth is, it’s going to be here until at least 2016, and probably a lot longer than that. If my math is correct, by 11/2016, debt is at $21T, and the deficit is starting to accelerate. I’m not sure we make it that far anyway, but anything is possible…well..except this budget proposal ever becoming relevant.
Note to Paul Ryan…or President Obama for that matter…if you want/need a competent excel jockey…fire your guy and give me a call….but I’m going to need to work from home 🙂


