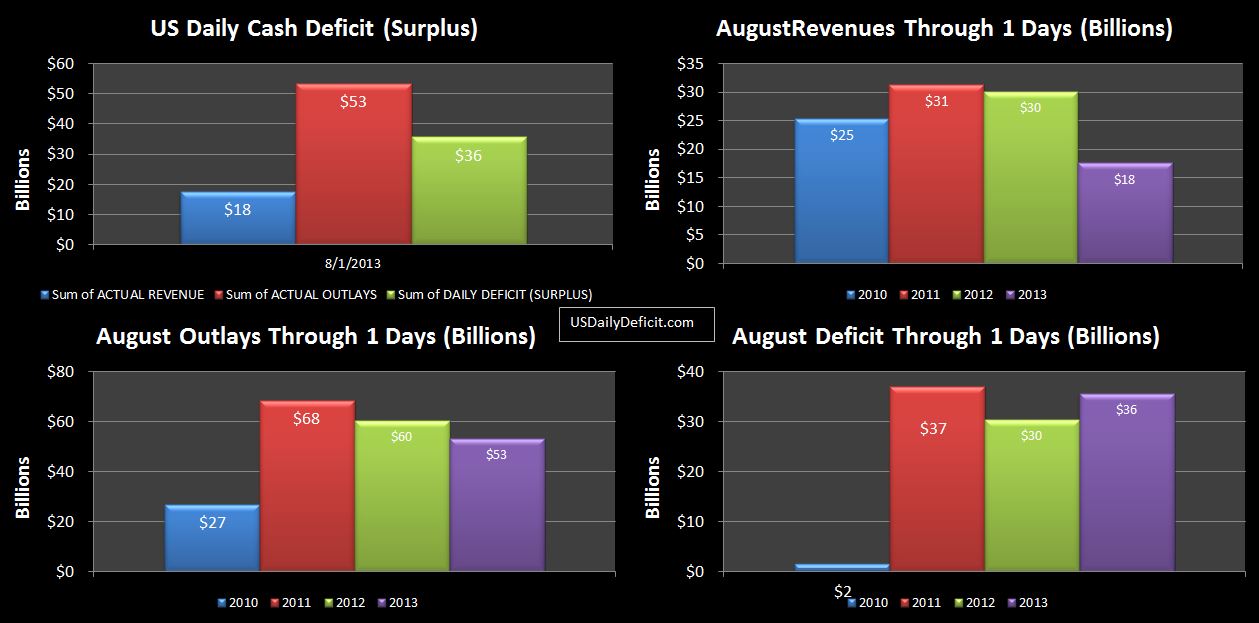
The US Cash Deficit for 8/1/2013 was $35.7B as typically strong first of the month outlays overwhelmed the $18B of revenues.
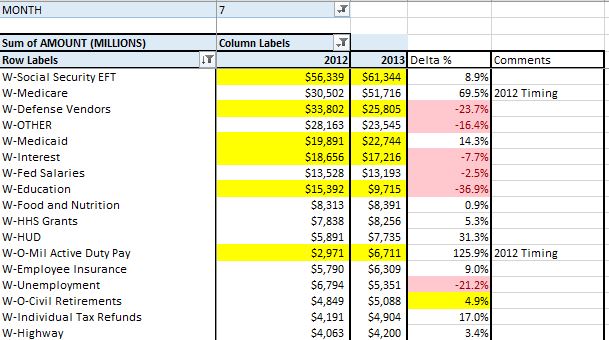
Let’s start off the month by talking about timing of August 2013 vs 2012. 2012 started on a Wednesday and ended on a Friday. 2013 starts a day later on a Thursday and also ends on a Friday… and thus has one less business day. Since deficit timing better relates to days of the week, and 2012 has an extra day anyway…I’m going to give 2012 that extra day from the start rather than waiting till the end….So…today, I am comparing Thursday August 1 2013 to August 1&2 of 2012. From here on out, my days of the week are synchronized, and within a week or so, the extra day should more or less become noise. Two more timing things to note. First…Social security checks for rounds 2-4 will be six days delayed from last year due to the timing of the 2nd through 4th Wednesdays of the month. And finally…in August 2012, due to the Labor day holiday…about $60B due 9/1 through 9/3 was paid on 8/31. This month…only ~35B of that will get pulled forward…the $25B SS payment due on 9/3 will likely go out on 9/3 since the holiday is 9/2.
So…with all of that behind us…last August we posted a $211B deficit. After adjusting for timing, increased revenues and a decrease in outlays, my initial deficit estimate for August 2013 is $155B.
Cash on hand to fund the estimated $119B deficit (remaining for the month)…remember we can’t borrow any more… is only $79B. Treasury shouldn’t have any trouble funding this shortfall…on 7/31, they managed to create $58B of cash out of thin air (or we would be at $21B), it would be foolish to think they couldn’t do it again. That is what makes forecasting the debt limit nearly impossible. I can take the current cash balance and forecast what day it runs out with pretty good accuracy. But I can’t forecast when Lew will wiggle his nose and poof…create $50-$60B…. and I can’t forecast when his magic will run out…making the whole exercise more or less a fools errand. They say October-November…sure why not…
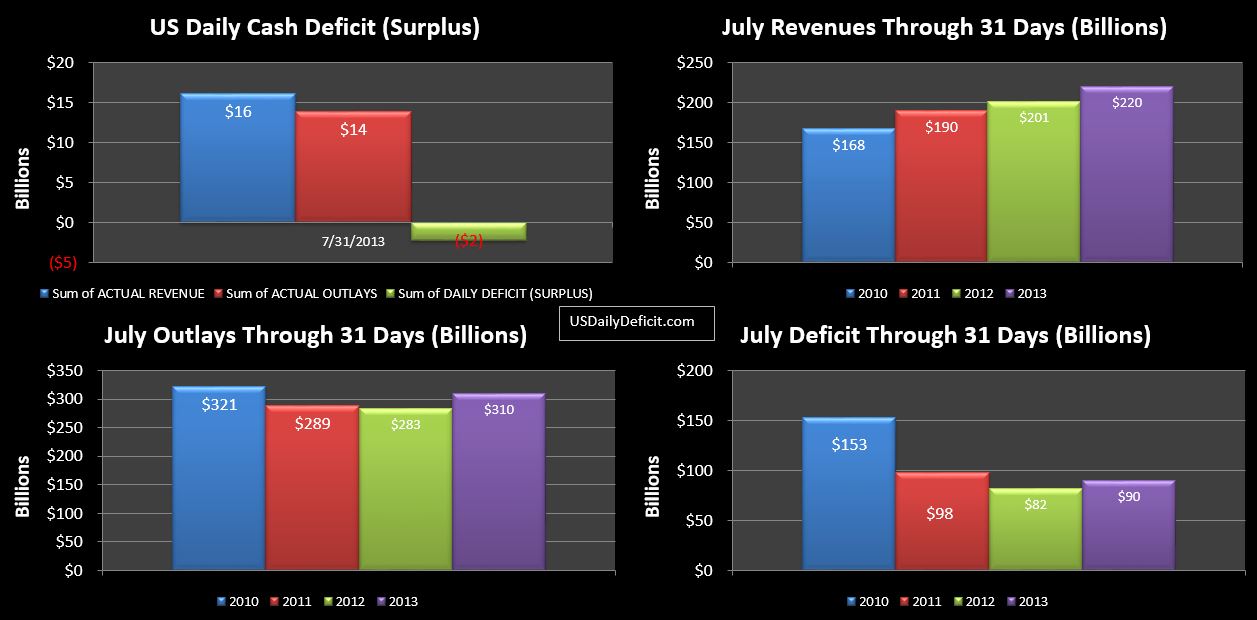
The US Cash Surplus for 7/31/2013 was $2.2B bringing the July 2013 deficit for the full month to $90B exceeding the July 2012 deficit of $82B by $8B.
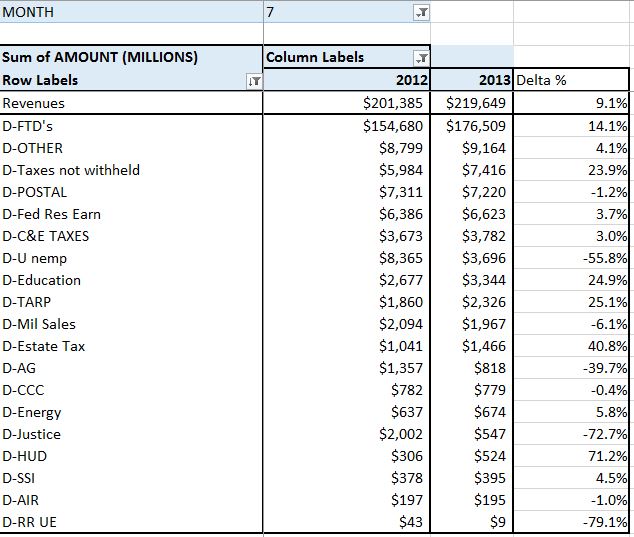
As expected, the last day of the month brought in strong revenues and strong outlays. $16B of revenues helped push yesterday’s meager 1% YOY gain all the way back up to 9%…respectable, but well under the pace set in the Jan-April period. Just for reference…YOY gains in revenue from Jan-April were about 15%…May through July, adjusting for the Fannie Mae payday loan is running at 9% YOY growth.
I’m pressed for time now, but will try to crank out a more in depth July review over the weekend. In the meantime…we get a first glance at August in just a few hours.
Per the June Monthly Statement of Public Debt, of the $11.9T of public debt outstanding, about $1.568T of it is bills…that is 12 months or less, and about $1.320T of it is 30 year bonds. So the $ of bonds outstanding are roughly about the same…just a $250B difference…. a rounding error really 🙂
This is what I find amazing….the annual interest paid on the 30 year bonds is about $68B per year according to my calculations. Anybody wanna guess the annualized interest on the bills? A mere $1.5B….for an effective interest rate a little less than 0.1%. The weighted average rate on the 30 year bonds is about 5.12%….54X higher!!
That blows my mind…the annualized interest paid on this $1.6T of debt is a mere $1.5B. Where do I sign up? Anybody think the Bugatti Dealership will float me a $2M interest only loan for a Veyron??
On the other side of the equation, bonds make up only 11% of the debt outstanding, but their $68B of annualized interest expense makes up a full 31% of the $220B of interest paid over the last 12 months.
It has never been clearer to me that the whole point of all the interest rate manipulation…QE 1,2,3,XX ect… has absolutely nothing to do with stimulating the economy, stimulating lending, the housing market, the jobs market ect… No, the singular point of all that nonsense is simply to keep the budget deficit from exploding. It’s hard to go technically bankrupt if you can borrow an infinite amount of money at effectively 0%. But when they lose control…and they will…it’s game over. Effective rates on the debt outstanding are under 2%….even a mild increase to 4% and boom….it’s over. Just imagine if one day the world woke up and realized that lending $11.9T unsecured debt to the morons that run our government (with an astounding 15% approval rating) at effectively 0% (after inflation) is a pretty stupid thing to do. Don’t get me wrong…I’m not holding my breath. 30 years of stupid isn’t going to fix itself overnight…but it will work itself out someday.
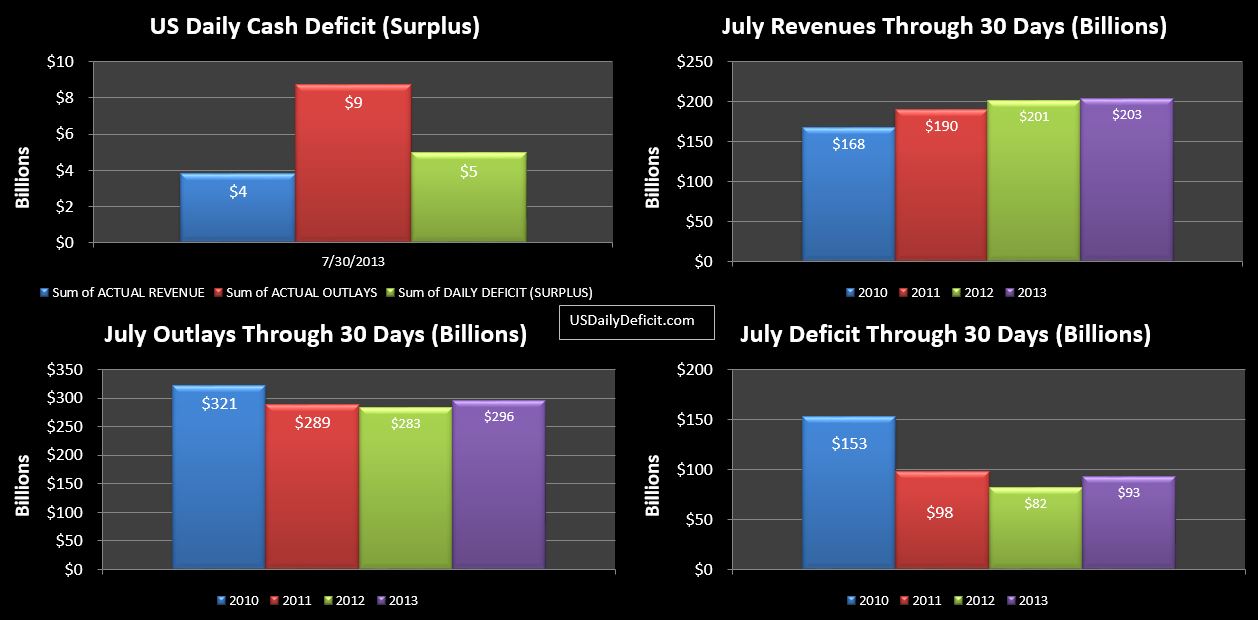
The US Cash Deficit for 7/30/2013 was $5.0B pushing the July 2013 deficit through 30 days back up to $93B with just one business day remaining.
Recall…I aligned 2013 and 2012 by business days and day of week…So we are comparing 21 business days to 21 business days, but July 2013 has an extra day, so we are comparing All of July 2012 to 30 days of July. This is more or less what the month would have looked like without the extra business day….Flat revenues, and adjusted for timing, small, but noticeable reductions in outlays.
Yet…we do have an extra business day, so we can probably expect an additional $10-15B or both revenues and outlays. It still looks more likely than not revenues, even with the extra day will come in under 10%….August…which loses a business day could be downright ugly…
