Category

Commentary

How Does Costco Pay Higher Wages Than Wal-Mart??

By | Commentary, Quantum Economics

Emily Fox has an interesting article over at money.com today :Worker wages: Wendy’s vs. Wal-Mart vs. Costco. Apparently…Costco pays its hourly workers about $20 an hour, with health benefits and a 401k, compared to an average of $13 at Wal-Mart. So…of course, the liberal answer is quite simple…let’s just raise everybody’s wages….double or triple them…and everything will be right with the world…right?

Well…no. You see…if I had to bet…Costco pays more simply because they have a very different  human resources strategy. Rather than hiring a lot of low level, borderline employable people like Wal-Mart…instead, they are willing to pay much higher wages…for a much higher quality employee. You pay more…you get more.And it seems to be working for them…their sales per employee is nearly double that of Sams Club according to the article.

So…you see… Costco didn’t just take a lot of minimum wage employees and triple their wages like the liberals seem to believe. No…they went out and hired competent, productive employees….who happen to cost about $20 per hour. Yes it costs more…but for them, the increase in productivity, lower headcount, lower turnover, and satisfied customers make it worth it.

Now…this isn’t to say one strategy is better than the other…clearly both Wal-Mart and Costco are doing quite well…despite very different strategies. Just don’t confuse the correlation with the causation. Costco employees aren’t better at their jobs because they are paid more…they are paid more because they are better employees. You could take a Wal-Mart cashier making $8 an hour… odds are….they wouldn’t make it a month at Costco before being fired.
 

Does College Still Pay Off??

By | Commentary

Does College Still Pay Off?” asks  Pat Regnier  over at CNN Money. Of course it does assures the president of Arizona State University.

Our calculations and those of economists say the return on investment for a college education, in terms of additional earnings, is about 12% per year over your lifetime. The answer is unequivocally yes.

Honestly…that doesn’t sound like much, but I thought there was a very interesting statistic about halfway through the article…after 6 years, only 57% of ASU students have managed to graduate. I’m quite curious…are those remaining 43% included in the population included in the calculation? I seriously doubt it.

So a better way of looking at this is…If I take a random 18 year old high school graduate and send her to ASU, there are a handful of potential outcomes.  In scenario 1, the student makes it through the program and earns a degree. Lets just say it takes an investment…five years of her life, plus $60k. For this…she goes on and earns 12% more than she otherwise would have. This is the outcome a little over half… 57% ….of the time. Hooray!!

Now…Scenario 2 is not as pretty. 43% of the time…the student will invest at least a couple of years, and lets just say $30k….and end up with no degree. In the oil business, we call that a dry hole, and while it sure does make your performance numbers look better if you can ignore them and focus on the home runs, odds are, your CEO is going to call BS if he sees you trying to pull that in your annual performance review.

But then…this isn’t the real world…it’s education, where you get to make up whatever statistics you want in order to perpetuate the myth that keeps the money rolling in. More or less, the myth goes like this. Send us your 18 year old kid, and $50-100k…or more….and in 4-6 years we’ll send him back…he will no longer be a dumbass.

Of course..it is just a myth. If you send them your lazy dumbass 18 year old, and $100k…odds are, in 4 years, they keep the $100k and send lil’ dumbass home to live with you (and drink your beer).

So…here is my answer. College does pay off….if the kid already has the right combination of raw intelligence and ambition. Raw intelligence…by itself, is of little use….you need the complete package. It’s the complete package that matters most. A lot of ambition and hard work, plus moderate intelligence could very well be a more successful combination than a lot of raw intelligence and a little bit of ambition.

Furthermore…for these students, perhaps 30% of the population…Whatever success they achieve after college can be 99% attributed to their natural talents…not their education. Employers hire people with college degrees not because of what they think they may have learned in school, but because of the credential. If you have a college degree in engineering from a state university, it tells potential employers something about you they didn’t know before. It tells them you probably have above average intelligence. It tells them you have the ability to set and achieve short, medium, and long term goals. It tells them you have the ability to be taught, and more importantly to teach yourself. And since you have demonstrated these skills….there is a much better chance you will be successful in their organization than some random 18 year old kid….even the same kid 4 years prior.

The college degree itself proves only that you may have potential. The company knows damn well that the 22 year old petroleum engineering graduate knows almost nothing about the real world of petroleum engineering or the oil business. That kind of  valuable knowledge will never be attainable in a classroom. However…they are willing to hire the 22 year old because of what they will be able to do after a decade of training.

Now…it is by no means a fool proof selection system. Plenty of sub par candidates manage to get a college degree and into an entry level  position. If they never had the right stuff in the first place…they are not going to make it in the workplace…regardless of the degree. So…say Ivy League Jr. Gets into Harvard because of Mommy and Daddy’s contacts, but unfortunately for lil’ Johnny…he’s just not college material. When he gets out of Harvard 5 years later thanks to a few hundred k of Daddy’s money and a lot of “tutoring”…he very well may get that first job….but odds are…he’s going to get fired sooner or later. The employer hired Johnny because statistically…hiring a Harvard grad gets you a lot of intelligence and a lot of potential. As soon as they figure out Johnny can’t hack it without a tutor holding his hand…he’s done. So in this case…even though Johnny got the highest “quality” education possible…in the end it didn’t make one bit of difference.

I am quite confident that the inverse is also true. Take a kid who grew up in poverty, but blessed with incredible intelligence and a hard work ethic and send him anywhere…community college…or maybe even ASU 🙂 Ten years after college….this kid is going to be working side by side with the Harvard grads of equal skillset.

So…bottom line, as I discussed here, college is not about education at all, it is about credentialing. Basically, College is a 4(-6) year comprehensive IQ test employers use to identify candidates who have the potential to perform complicated, and thus high $ tasks. So…if you have a smart kid, who is highly motivated to succeed…by all means…send them to college (any college) to get a degree in math, science, engineering, medicine, education…or maybe even accounting 🙂 For them, if they are successful, the degree will get their foot in the door and allow them to prove (or disprove) to the world they have the right stuff.  For these kids…the payoff for a college degree  is huge. However…if the kid just doesn’t have it….you can send them to Harvard for that Liberal arts degree…and in 5 years they will be back at home working at JC Penny or if they are lucky…Starbucks, and they will have essentially wasted 5 years of their lives, and a whole lot of your money.

**Just a quick clarification…obviously we are discussing the monetary return of going to college. It has been my experience in life that intelligence and  certainly income have absolutely zero correlation with character. So, let me be perfectly clear…An individual’s intelligence…be it 80 or 120, is simply a measurement of a physical characteristic..no different than height, weight, shoe size, or beauty. None of these tell us anything about the quality of the character or value as a human being. However…it is naïve to think that our physical characteristics do not influence our earning capability. At 5’8″, and 170#…my odds of ever playing in the NBA, or becoming an offensive lineman in the NFL were infinitesimally small from the moment I was conceived….I simply lack the genetic profile to exceed at these high paying professions. Same goes for countless other professions. Forget the arts…I can’t sing and my six year old son makes fun of the stick figures I draw. Construction…not a chance. About 10 years ago I bought a $10 book with plans for building a shed…and about $1000 of materials to complete the job. A few months later, I had the ugliest most poorly constructed shed in town. As it turns out…about the only thing I am professionally competent to do…is accounting and finance. Fortunately for me, this seems to be a rare talent that happens to pay well enough to keep a roof over my head and a protector in my pocket. Let’s just get it out there…the whole system is screwed up and beyond repair. Companies are to blame, government is to blame, colleges are to blame, and parents are to blame. Sending a kid in the bottom quartile of his class to college to get a degree in liberal arts benefits nobody but liberal arts professors and the colleges that employ them. Not everybody can grow up and become a rocket scientist….We need to start being honest with our 18 year olds about their prospects before we let them become slaves to their student loan debt. There are plenty of paths to financial and nonfinancial success in life that do not require a college degree.

July 2013 Deficit Review

By | Commentary
The July 2013 deficit at $90B, was $8B higher than last July’s $82B deficit. It’s not a huge miss, but a deep dive into the details will tell a little bit different story.
Revenues:
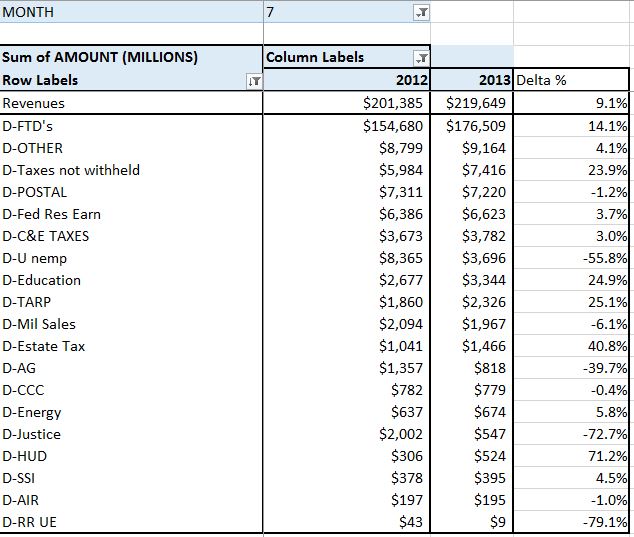
Net cash revenues came in at $220B compared to $201B last year for a 9% YOY growth. Without a doubt, it’s a good number, but it is a material step down from the 15%+ we averaged over the Jan-April period. The chart below shows the YOY revenues for a selection of the larger cash revenue categories.

08-04-2013 July Revenues

The top line has total cash revenues. Most of the story can be seen in the next line…Federal Tax Deposits (FTD’s). Up $22B, 14%. It was aided by an extra day, but no matter how you look at it, this is a good solid number. Taxes not withheld were also up…this time 24%, but this is a slow month, and that only netted $1.5B. The only other material change worth noting was the 56% reduction ($4.7B) in unemployment deposits from the states. Believe it or not, this program is kinda sorta actually run like an insurance program, so I can only guess that perhaps premiums have decreased as we ease ourselves away from the Great Recession?? In any case, this category is usually good for $50-60B per year of cash revenues that I had projected to grow at 5%…I may need to revisit that assumption. But bottom line on revenues…up by a healthy amount, just not as much as before. It wouldn’t shock me one bit if we saw this ~10% growth continue through the rest of the year…It’s what comes in January 2014 that we should be concerned about.
Outlays:
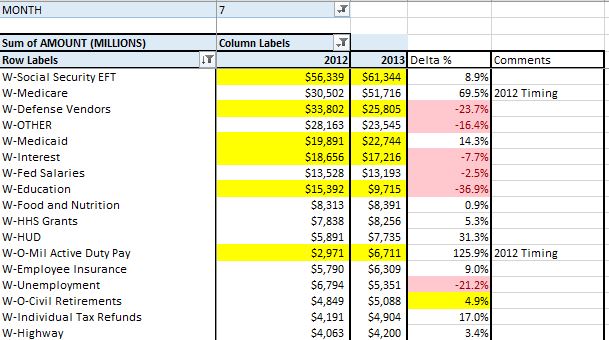
Cash Outlays were up $27B YOY from last year’s $283B to $310B in July 2013. However….last July was about $35B light due to payments due 7/1 going out early because of the weekend. If we adjust for this, we actually see an $8B overall reduction.

08-04-2013 July Outlays

Of note in July, we see Social Security’s constant and scary growth….8.9%….$62B per year annualized  and accelerating. Nearly all of the reductions appear to come from Defense Vendors and Education…but it is interesting that we continue to see small reductions in cash interest expense…no surprise as discussed in detail here. Basically, even though rates have come up a bit from extraordinary lows, the debt coming due is being rolled at lower rates than it was issued, bringing the weighted average rates down enough to lower the total interest paid, even with $800B of additional debt.
DEBT:
External debt was up a mere $16B from June, from $11.901T to $11.917T as the debt limit continues to suppress “reported” debt. YOY, debt was up $800B from $11.1T to $11.9T, pretty much in line with the TTM deficit. Now…it is important to note that “extraordinary measures”(EM) used to circumvent the debt limit do not affect the cash deficit, which as far as I can tell remains correctly reported. Instead… EM essentially lets the government park debt off balance sheet unreported…while still issuing new debt (for cash). It’s hard to tell exactly how much has been hidden over the last few months, but I’d guess it is between $50-$100B….wild ass guess.
Summary:
While the headline number was disappointing, adjusted for timing, outlays were down and revenues were up….what more could you ask for? Outlays should continue to run a little under  last year at least through September…after that…who knows?? It really depends on what kind of deal the Republicans and Democrats hammer out. Higher outlays would seem like the safe bet, but anything could happen. Revenues will likely stay around +10% or so for the rest of the year. 2014….I’m not so sure. CBO is projecting another 2 years of +10% revenue gains, but just I don’t see how we get there. So…let’s just enjoy this deficit “improvement” while it lasts.

Fun With Math: 8/1/2013

By | Commentary

Per the June Monthly Statement of Public Debt, of the $11.9T of public debt outstanding, about $1.568T of it is bills…that is 12 months or less, and about $1.320T of it is 30 year bonds. So the $ of bonds outstanding  are roughly about the same…just a $250B difference…. a rounding error really 🙂

This is what I find amazing….the annual interest paid on the 30 year bonds is about $68B per year according to my calculations. Anybody wanna guess the annualized interest on the bills? A mere $1.5B….for an effective interest rate a little less than 0.1%. The weighted average rate on the 30 year bonds is about 5.12%….54X higher!!

That blows my mind…the annualized interest paid on this $1.6T of debt is a mere $1.5B. Where do I sign up? Anybody think the Bugatti Dealership will float me a $2M interest only loan for a Veyron??

On the other side of the equation, bonds make up only 11% of the debt outstanding, but their $68B of annualized interest expense makes up a full 31% of the $220B of interest paid over the last 12 months.

It has never been clearer to me that the whole point of all the interest rate manipulation…QE 1,2,3,XX ect… has absolutely nothing to do with stimulating the economy, stimulating lending, the housing market, the jobs market ect… No, the singular point of all that nonsense is simply to keep the budget deficit from exploding. It’s hard to go technically bankrupt if you can borrow an infinite amount of money at effectively 0%. But when they lose control…and they will…it’s game over. Effective rates on the debt outstanding are under 2%….even a mild increase to 4% and boom….it’s over. Just imagine if one day the world woke up and realized that lending $11.9T unsecured debt to the morons that run our government (with an astounding 15% approval rating) at effectively 0% (after inflation) is a pretty stupid thing to do. Don’t get me wrong…I’m not holding my breath. 30 years of stupid isn’t going to fix itself overnight…but it will work itself out someday.

Fannie Mae Payday Loan: Revenue Or Reduction In Cost??

By | Commentary

Back in May, the CBO released an updated forecast of FY2013 that was a $200B improvement over the forecast they had released in February…basically on a $100B decrease in outlays and a $100B increase in revenues.

In my review here, the reduction in outlays was quite puzzling For a few years now, we have been running more or less flat costs as increases in Social Security and Medicare quickly gobbled up whatever tiny cuts were actually made. So…I thought it was very odd that with only 5 months remaining, they would predict…all of a sudden a $100B reduction, or $20B per month remaining in the FY.

After comparing the Monthly Treasury Statement (MTS) with the  Daily Treasury Statement (DTS) for June… I have a much better understanding now. It seems that rather than categorizing the Fannie Mae special dividend as revenue…like I have, they instead classified it as a reduction in outlays. From a deficit perspective…it really makes no difference. From an accounting perspective, well, I can see it going either way, so I don’t think there is anything shady afoot…. well, there is a lot shady about the payment, but I don’t have any vehement objections to this classification of outlay reduction instead of revenues 🙂

At the time, I suspected that the revenue increase was primarily the Fannie Mae payment and the cost reductions were somehow related to extraordinary measures pushing cost out of FY 2013 and into early FY 2014, so maybe I got that part all wrong….maybe:)

So, lets look at revenue…which I had just assumed was Fannie Mae. Since it wasn’t, they must have expected a bona fide $+100B in revenue. With 9 months of MTS data in the bank, we are $726B under the CBO’s may outlook of $2.813T. Looking at year ago numbers, we see that July to Sep netted $625B in revenues…so a 16% YOY improvement should get them there.  But…with July currently at 7%….and looking to end ~%10 without any surprises…we are going to need a very solid September to pick up the slack. unfortunately, we seem to be seeing a slowdown in revenue growth that could make this difficult. The Jan-April period saw 15.5% YOY increases….the May-July period looks to have slowed to right around 10%…more or less as predicted.

Now…a final note on the MTS…I don’t like it and I don’t trust it. You may be tempted to assume that the MTS is just a summary of the DTS…it’s not, in fact several attempts by me to reconcile the two reports have failed miserably. Treasury informed me a while ago that in fact, they are pulled from completely different source data. Furthermore. The MTS data is presented using a “modified cash basis…vs. the DTS, which is cash…period. Personally, I don’t really know what “modified cash basis” means, but I trust it just about as far as I can throw Chris Christie :). All that said…the MTS deficit numbers are the ones you are going to hear any time someone refers to the official deficit. keep that in mind in a few months when they start braying about how great a job the government has done at cutting cost….Once you back out the “cost reduction” associated with the Fannie Mae payday loan, it’s unlikely to be nearly as impressive.