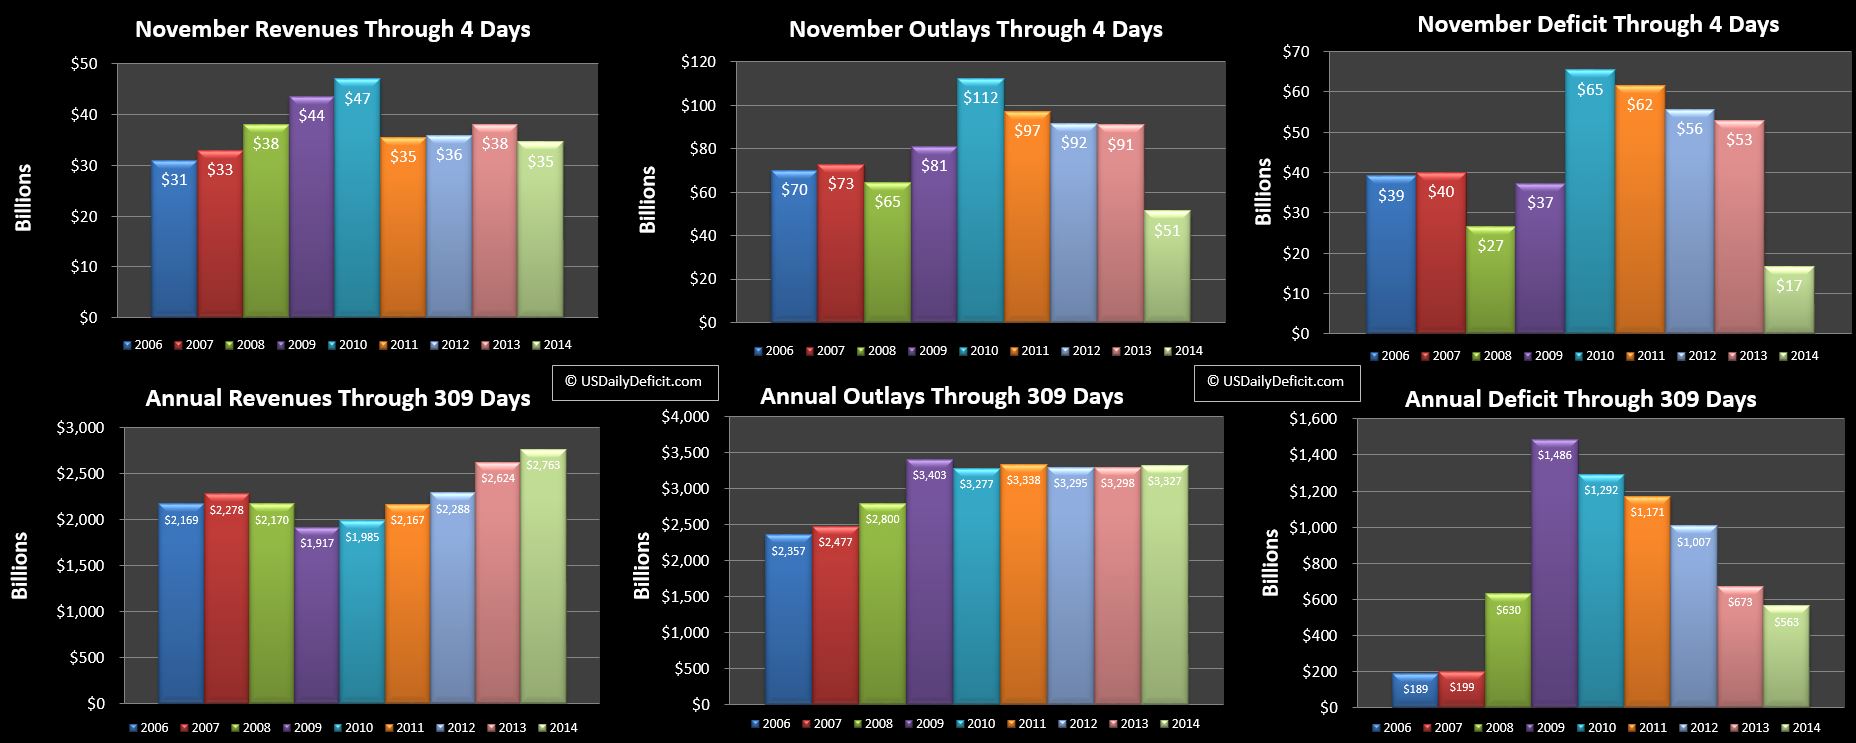
The US Daily Cash Deficit for Tuesday 11/4/2014 was $4.2B following Monday’s $12.6B deficit and bringing the November 2014 deficit to $17B through 4 days.
No real surprises early in the month. As is typical, I have adjusted the days to sync up 2013 and 2014 based on days of the week rather than straight day of month. So the chart above is comparing November 2013 through Tuesday 11/5 to November 2014 through Tuesday 11/4. This results in 2014 being behind one business day…a handicap it will retain for the remainder of the month.
Revenue starts off the month down just $3B….not a bad start considering we are down a day. To hit +5% we’ll need to get to +10B….10% will require +$20B.
Outlays are off a lot…down $40B, but I would guess $30B is timing….the costs that were pulled into October, and $10B is the missing day. I am not expecting this to change….while November 2014 will end up light on costs due to timing…November 2013 actualy got a double whammy…getting the typical monthly costs plus December 2013’s share…. It’s hard to say with certainty, but November 2014 outlays could be down $60B. This actually happens quite a bit, and is just one of the curveballs that can throw off the monthly analysis.
Of course….timing issues don’t affect our new YTD charts nearly as much as they resolve themselves within a day or two….and are part of a much larger base anyway. Our YTD revenues are up 5.3% and outlays are up just 0.9%.
Looking forward to the full month…I’m guessing we’ll end up around a $75B deficit for November 2014 compared to a $143B deficit a year ago. Timing is the big difference holding cost down, while revenue should be up 5-10% again if the trend continues. November’s gain is December’s loss however…expect a bit smaller surplus than December 2013’s $55B, though i won’t put out an official guess until early December.
