6/20/2013 Daily US Cash Deficit

By | Daily Deficit

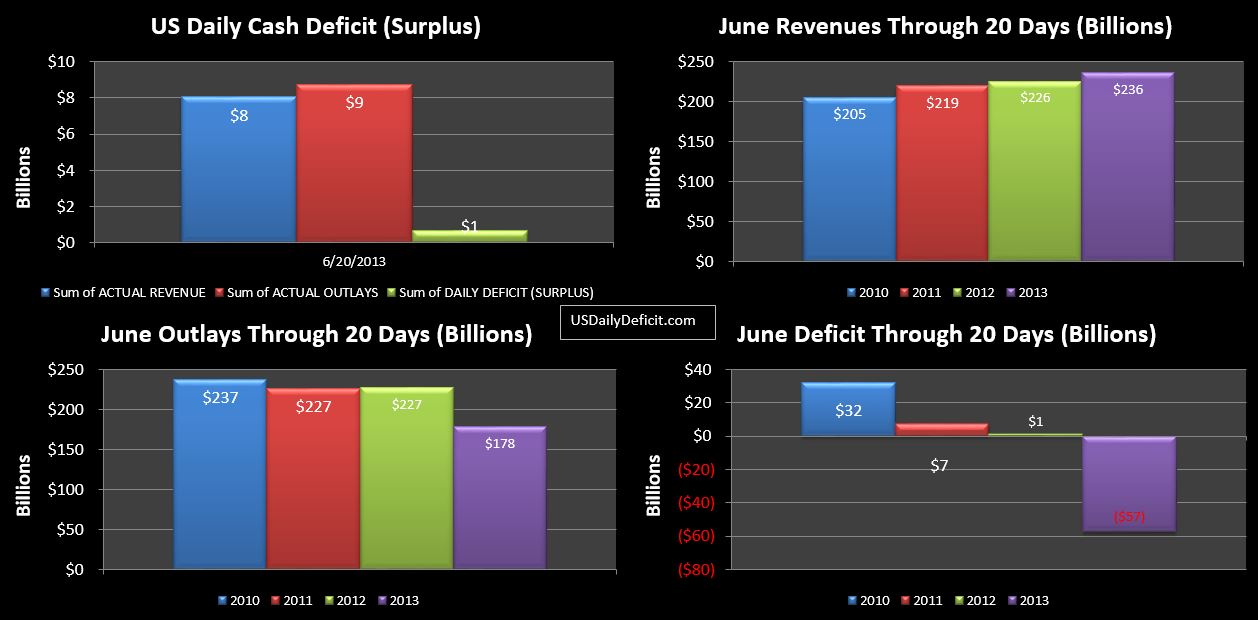
The US Daily Cash Deficit for 6/20/2013 was $0.7B bringing the June 2013 Surplus through 20 days to $57B. While declining, tax deposits “not withheld” did not drop off as steep as they did last year, putting a $2B dent in the YOY gap, and pushing the 21% decline we had through yesterday down to 15%. With a $6B gap remaining, it doesn’t look like we will come close to posting a 32% YOY gain like we saw with the first four months of the year. While obviously anything could happen…a second month of actual declines from this revenue category seems likely at this point.

06-20-2013 USDD

With six days left…I’ll go ahead and forecast the June deficit, if for no other reason than to see how much I can miss it by 🙂 Flipping back a few weeks, I think my last estimate was $105B surplus. As it sits, we are at $57B. I’ll add $60B for the rumored Fannie Mae payment….though I find it odd that I have not been able to find any recent news stories on this. That gets us to $117B surplus. I’d actually be happy staying with $105…assuming that we’ll run a $12B deficit (excluding Fannie) over the next 6 days, but that seems a little light, so I’ll bump it down $5 and just guess and even $100. If Fannie doesn’t come through, or we get some other surprise revenue…like from Tarp or Freddie….I could miss big, but I don’t really have a good way to guess those…we’ll just have to wait and see.
6/19 Daily US Cash Deficit

By | Daily Deficit

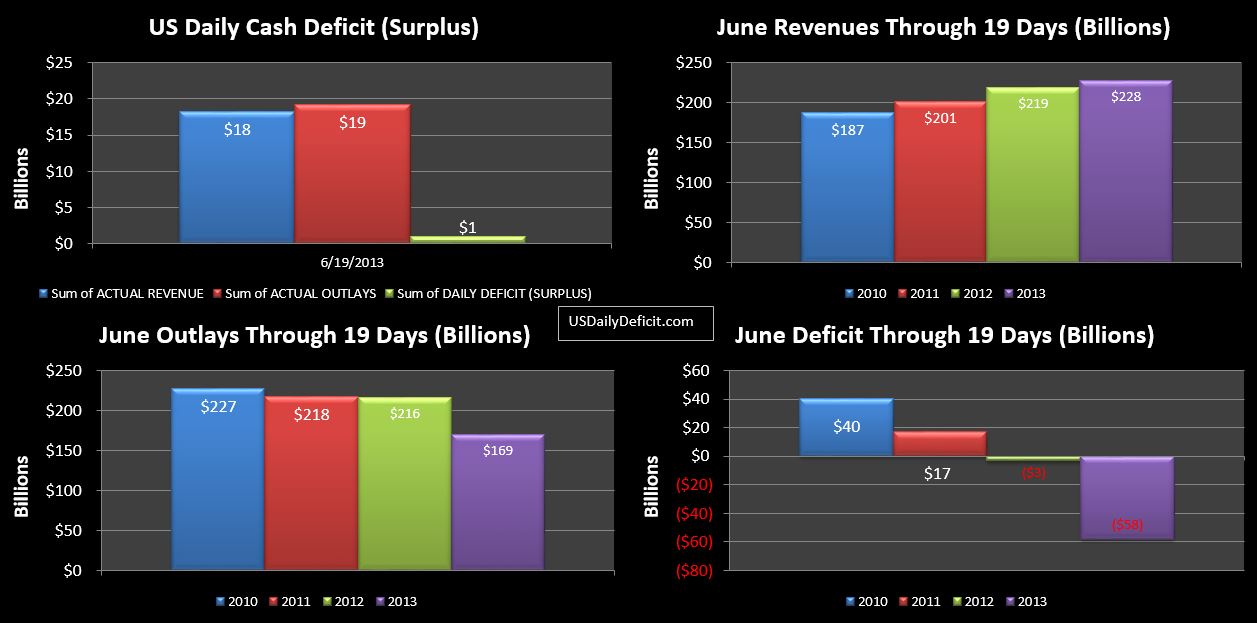
The US Daily cash deficit for 6/19/2013 was $1.1B….marking the first deficit in a few days 🙁

06-19-2013 USDD


The charts continue to look impressive, but it is mostly an illusion based on the apparent large drop in outlays…. $47B. I want to revise some of the numbers I threw out yesterday, after closer analysis today, I didn’t quite have it right when I pondered that $12B of the improvement was related to social security timing…forgetting that I had already adjusted for that by including an additional day in 2012.

Of the $47B, I am now estimating that $35B, rather than the $30B I have been using all month is a better estimate of the costs that shifted into May. Of the remaining $12B, as of today, I am left to believe these are bonafide decreases in outlays(through 19 days). Just eyeballing it…looks like defense vendor payments are down $4B and education department programs are down $4B, with the rest spread around a dozen smaller categories. I wouldn’t get too excited yet, but facts are facts….lets see what happens.

Revenues continue to disappoint (me at least). Net revenues are up 4% YOY, taxes withheld are up 8%, and taxes not withheld are down 21%. Corporate taxes are still up 9%. The key to any long term budget solution is first holding cost constant….something we have actually been able to do for the last 3 years or so (not for much longer though…thanks to social security). Second…you have to be able to grow revenue…for a sustained period of time at or around 10%. For reference…2010 actually decreased over 2009, but was basically flat. 2011 posted an 8% increase and 2012 posted 6%. For a brief moment in time… the first 4 months of 2013…we were running at 15%…very impressive. Yet…after the tax season…we find ourselves sinking back to the middle single digits.

If you’ve ever modeled exponential growth…you realize that the difference between 5% and 15% in year one can be pretty big by the time you get out to year 10. The CBO is projecting 10-12% growth for the next 3 years….I’ll be surprised if we get half that after 2013. Add a sell off in the stock market, and even a mild recession, and you could go negative in a quarter or two….completely tanking the rosy CBO projections our brilliant politicians are using to make extremely important decisions (not that it really matters)..Ok..enough doom and gloom…I should probably wait a for a few more months of data…after all…we should be getting a cool $60B from Fannie Mae any day now…


6/18/2013 Daily US Cash Deficit

By | Daily Deficit

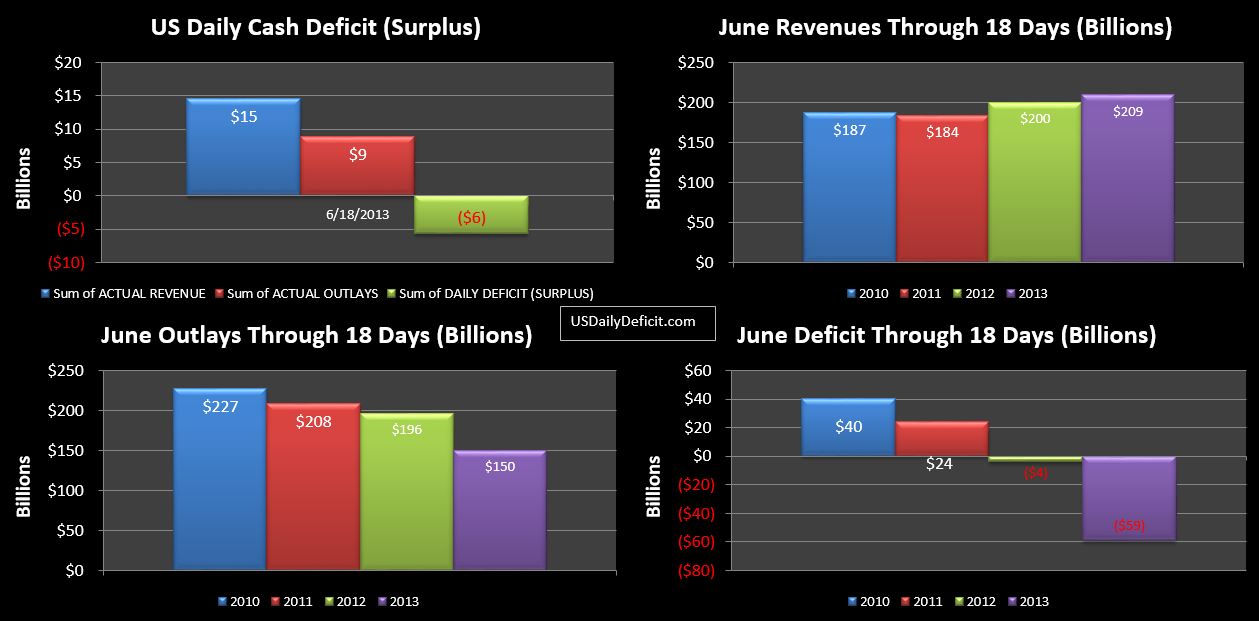
The US Daily Cash Surplus for 6/18/2013 was $5.7B as we got our first good glance at June “taxes not withheld” at $12.3B. There are still a few days of heavy inflows on deck, but at this time, we are down $6B, or 20% from last June. That’s not a good sign, but I’ll give it a few more days before I call it.

06-18-2013 USDD

As it stands…the charts don’t look that bad…let’s walk through it. Net revenues are up $9B, which sounds good, but it’s only a 5% increase…our baseline is at 12%. Cost, on the other hand, look to be down an amazing $46B. Of that…$30B is timing related to 6/1 payments going out in May. $12B is related to social security payments…that should catch back up tomorrow…and the rest is because I have an additional business day (6/19) for 2012. This more or less sync’s up the months/days and since June 2013 is going to have one less business day anyway….I feel this is a more accurate presentation of the data.

All this leads to an apparent $55B YOY improvement in the deficit, and we haven’t even received the $60B payment from Fannie Mae yet. But if we back out the cost timing and social security payment, and we are really looking at a $13B improvement so far….not impressive at all compared to what we saw between January and April. We have 8 business days to go….it will be interesting to see where we end up. Two disappointing months in a row (backing out one off revenues and outlays) is not a trend line we want to be on but it is looking more and more likely.

6/17/2013 Daily US Cash Deficit

By | Daily Deficit

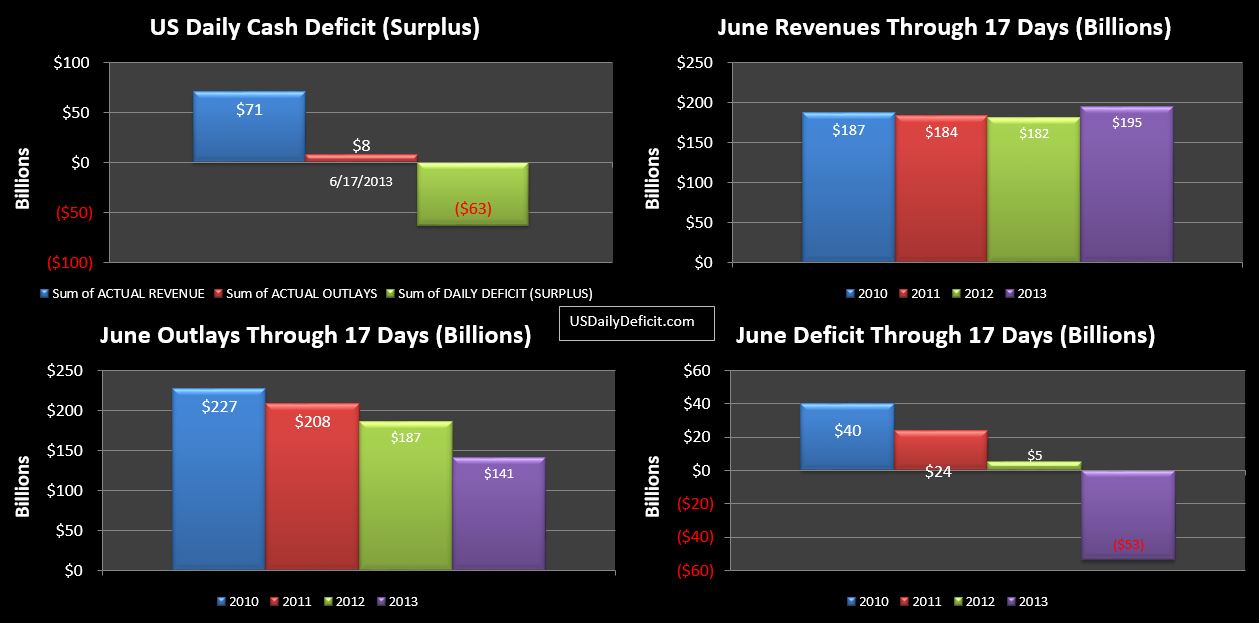
The US Daily Cash Surplus for 6/17/2013 was $62.7B on typically strong Monday revenues plus nearly $43B of corporate tax receipts. Note that this was not unexpected…we see this surge on the 15th of every quarter end month…this time delayed by a couple of days due to the weekend. Now…no getting around it…a 62B surplus is big…but what really matters is how we look compared to last year. As it stands, corporate taxes are up YOY by 9%. It’s definitely a good number, but considering that our five month average coming into June was 20% YOY…it is definitely a break in the trend. The month isn’t over…but if the historical trend holds….we can expect less than  $1B to trickle in for the rest of the month in addition to the $62B already received…so absent a break in that pattern…9% is about where we will end up. The evidence is starting to mount indicating that the large revenue increases we saw from Jan-April are not going to be sustainable.

06-17-2013 USDD

So with corporate taxes mostly behind us, up next are “taxes not withheld.” Remember..this is regular income and payroll taxes not withheld from paychecks like most people pay their taxes. This is going to be small business owners, investors….you 1%er type. This is where we saw a huge surge during the first part of the year….my hypothesis is that this was a one time spike due to the 2013 tax hikes. There are 4 months a year with large “taxes not withheld” spikes. January, April, June, and September. Don’t ask me why…but that’s the pattern. The rest of the months typically show less than $10B or so. If my hypothesis is correct….we should see a significant reduction in the YOY growth. In April the growth was 40%. June will provide us the first clean glimpse of 2013, unaffected by tax avoidance transactions. Right now, the YOY is -18%, but this is a rather small population. We should see most of the receipts come in this week. The YOY increase through 5 months was 29%…a significant deviation from that trend would provide pretty solid evidence to confirm the hypothesis….we’ll know by the end of the week.

Finally, just wanted to note that cash in hand has now grown to $113B though we are still up against the debt limit. This is quite a turnaround after bottoming out at $11.5B just two weeks ago in 6/3. Expect this to grow a bit more, especially when that $60B Fannie Mae payment comes through. Then, expect a downward plunge for July-August. A flat September might just squeak is by into the new FY in October. After that, a debt limit rise will be essential due to a low cash balance and ~250B or so of expected deficits between October and November.

6/14/2013 Daily US Cash Deficit

By | Daily Deficit

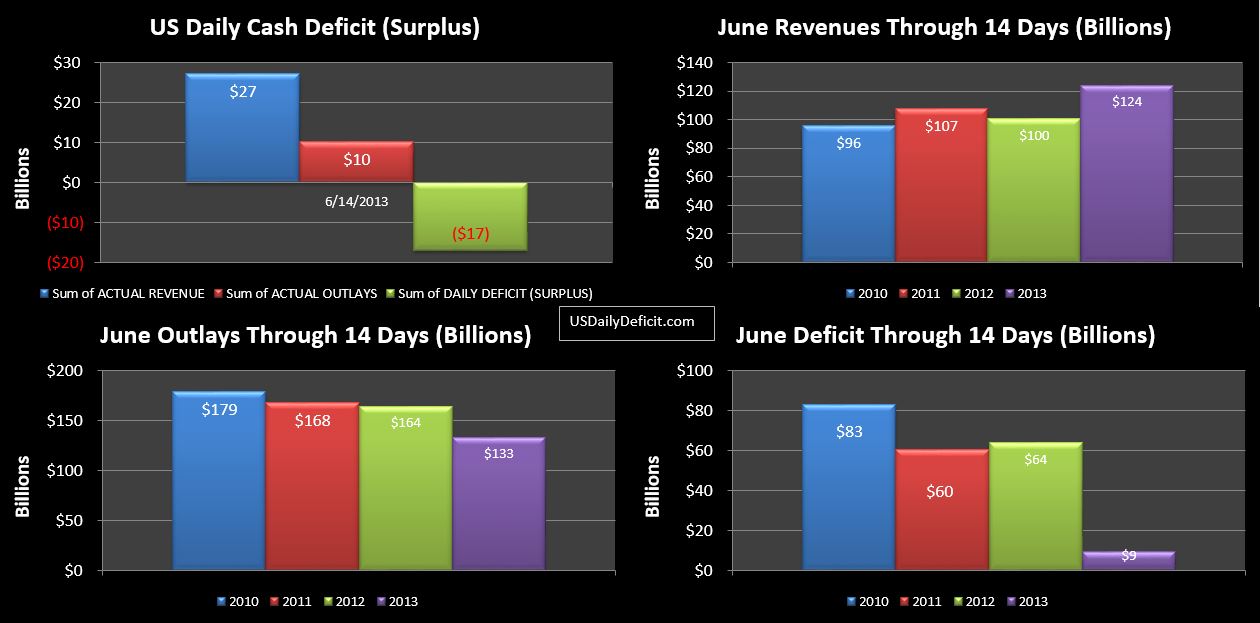
The US Daily Cash Surplus for 6/14/2013 was $17B as corporate taxes started flowing in. Though due 6/15…with the 15th on Saturday, $14B of corporate taxes flowed into federal coffersa day early…expect another $30-$40B before the week is out.

06-14-2013 USDD

At first glance…the charts look fairly impressive but a lot of this is timing due to a lot of corporate tax payments being made 6/14 that were made 6/15 last year. This should all flush out in a few days. On the cost side….adding back in the $30B we’ve been discussing for a while shows that cost is still flat….no surprises there.

Tomorrow’s report (for today) should show the majority of the remaining corporate taxes we will see in June. Through 5 months, 2013 corporate taxes have been running about 20% over last year….seeing how June compares to that rate should be a very interesting indicator.