June 2013 Deficit Update

By | Daily Deficit

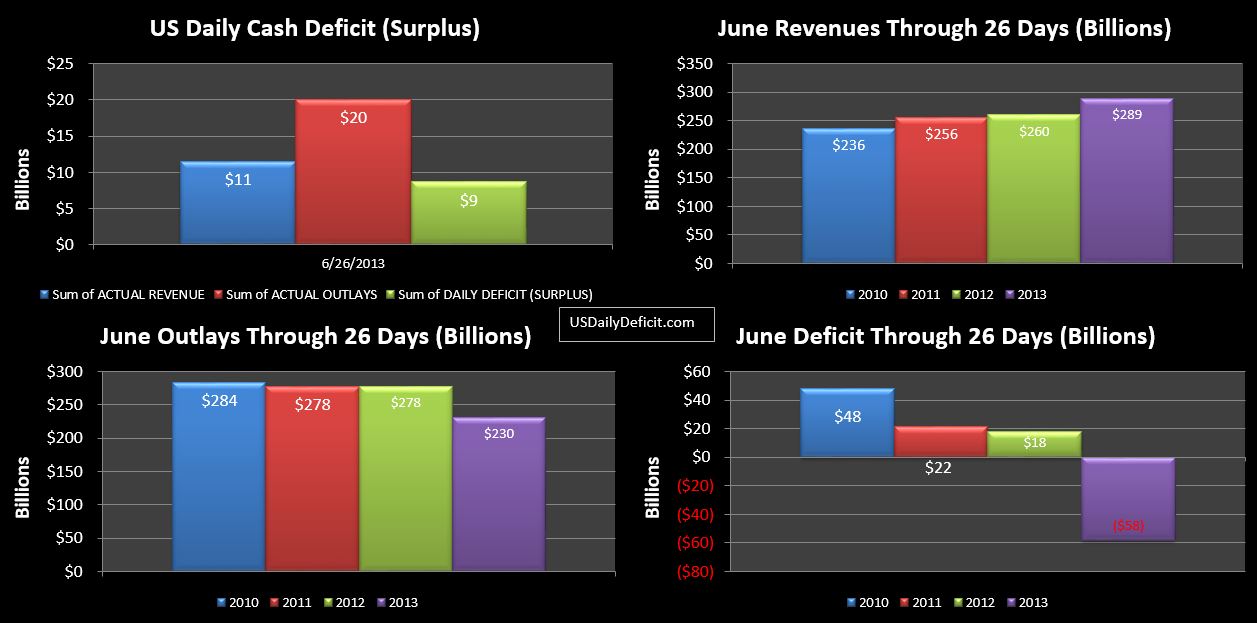
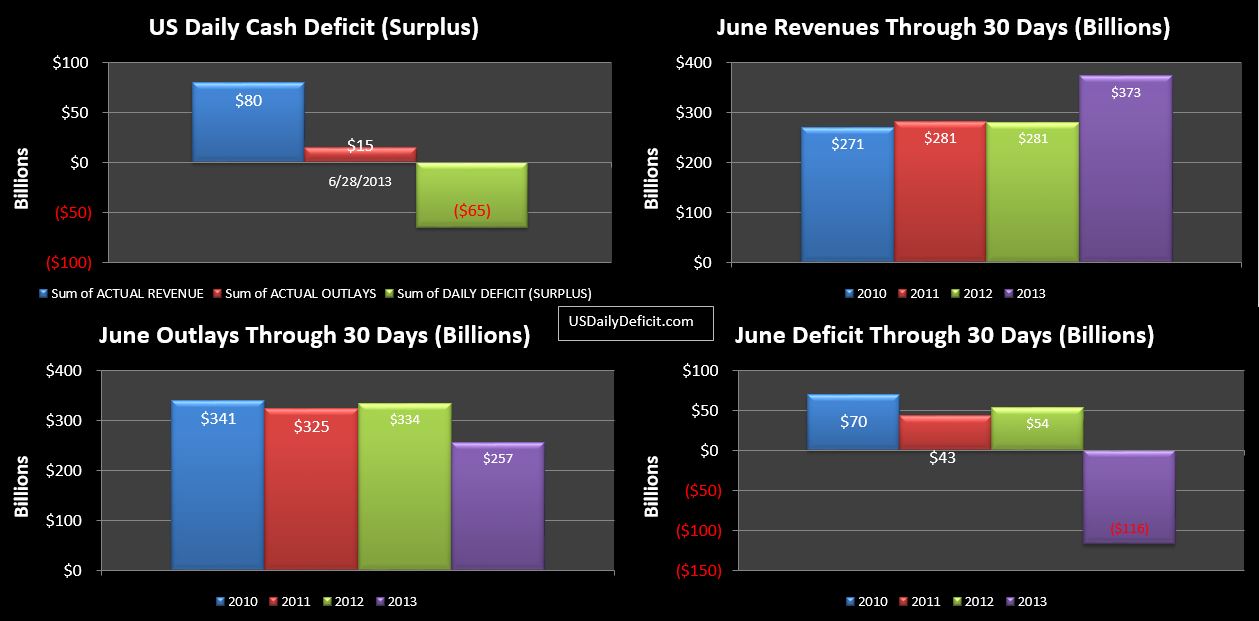
I’m running a bit behind schedule…what with the real job and everything 🙂 so I haven’t had a chance to put together a detailed write up for June, but I wanted to get the finals out there. So…The US Daily Surplus on 6/28 was $65.1B…thanks to the $66B “payday loan” from Fannie Mae. This brought the Monthly Surplus to $116B, a vast improvement over June 2012’s $54B deficit. Revenue up, cost down…pretty simple math. No doubt, it was a good month, but as we have been discussing all month…take out Fannie and about $65B of timing related to cost….and while it was still a good month….it wasn’t that good. Still…we’ll take it!!

Key takeaways…Tax deposits were up 9.5%. Taxes not withheld were up 16%. Corporate taxes were up 10%. Two months after the close of the January-April Tax season, excluding the Fannie Mae silliness, we see growth in net revenues stabilizing around 9% – 10%. Still…a very good number…pretty much in line with what you would expect after you raise taxes. But it does represent a material step down from the 15% we saw in the first four months of the year…recall my hypothesis…that the tax hikes drove many to pull income into 2012 to take advantage of lower rates….then they paid taxes on those gains in the first 4 months of 2013. If that is the case….rather than the 10-12% gains being expected by the CBO, 2014 could actually show declines over the first 4 months.

In any case…charts below, I’ll try to get out a more detailed analysis as time permits.

06-28-2013 USDD

Fannie/Freddie Make $66B Payment to Treasury

By | Commentary

Multiple news outlets are reporting that Fannie Mae did in fact make the $60B payment we’ve been discussing on and off…no surprises here….when we add Freddie into the picture, the total was $66B. Most of what I’ve read is just news clips…but this one  by Daniel Gross at the Daily Beast takes the cake.

“That payment of $59.3 billion is real money—equal to about 2 percent of all expected federal revenues for the current fiscal year. And it all goes to deficit reduction.”

It’s a nice Kumbaya kind of article…Everything is getting better…the bailouts worked……. But it’s all bull$#@%…. as I documented here. I never know any more if the journalists are really just that ignorant, or if they are just lying SOB’s. Quick…Somebody flip a coin.

So…let’s take another look at what has really happened here. Fannie Mae is essentially a government run operation., so whatever “profits” they make get handed over to the government.  So…let’s just say that in a given year, they make $10B before tax profit  They would send in $3.5B to the Treasury as “corporate taxes” and $6.5B as a dividend payment.

Now…say they have a “tax asset” based on past losses that basically shields all of their income from income taxation. So…this time around, they make the same $10B…and send it all to treasury as a dividend. Hopefully the point is clear…the very idea of one government entity paying “taxes” to another is a bit silly…am I right? The cake is still the same size, no matter how you want to slice it. Tax assets are of no value to government owned entities….

Back to Fannie….I think we can agree from the above example that taxes are irrelevant to the future cash flows they will generate for treasury. Despite this….Fannie Mae…not doubt prodded by Treasury, decided to write up the value of previously written off tax assets (from when they actually were kinda sorta a public company) back up….recognizing an immediate $50B gain. It’s kind of neat…you should try it. So open up your personal balance sheet….and where you have the value of your 10 year old car at $3k…..just write it all the way back up to whatever you paid for it, say $33k. Instant $30k gain. Don’t you feel richer now? Didn’t think so.

After writing up their imaginary assets that are pointless for what is in reality not a public company…then…They went out and got a loan for the full amount….then wrote a check to Treasury on their “earnings” This is actually kind of what everybody was accusing Mitt Romney and his band of corporate raiders of doing back in the day. Take over a business….then lard it up on debt and use the cash to pay yourself big cash bonuses. Then, you take the company public again… and a few years later the whole thing goes bankrupt because they can’t pay the outrageous amount of debt they have.

When it comes down to it…from a cash flow perspective, all Treasury has done is pull forward future cash to today….trading a bigger cash payment today for smaller future payments. I don’t know what kind of interest rates Fannie will pay on $60B of debt, but it’s probably a lot higher than treasury would have.

Finally, I just want to take a minute to clear up one other thing I thought was silly, but is often repeated. Gross mentions that Fannie has now paid back $95B of the $116B they took in bailout money. I have no reason to doubt the numbers, but I feel it misses an important point. If you lent somebody $1000 back in 1980….and they came back in 2013 and said…here’s the $ I owe you. Technically, yes…they paid you all back. Obviously you are happy to get it, but in saying you are even forgets a very important component…opportunity cost. You could have invested that $1000 over the last 33 years, getting say 5%, and ended up with over $5k.

Now, 33 years haven’t passed, but this simplistic analysis by Mr. Gross is either amateur or just plain misleading. Treasury had to go out and issue an additional $116B of debt, and pay to service it for the last five years…And who knows how much cost they incurred printing up those pretty annual reports. At least twitter is free, so it didn’t cost them any money at all to announce their $66B funny money scheme to the world.

For more info on the shenanigans…check out my original post here. It’s a lot of trouble for perhaps…three weeks worth of deficit relief?

Finally…just some thoughts on the value of Fannie Mae. Let’s just ignore all of the other $3T of debt Fannie has, and pretend for a moment that as of 6/27, Fannie Mae was generating a bonafide $20B of cash per year, and that the market would value this cash flow at say 10X, for a total value of $200B. Just pretend that this is what treasury could sell Fannie Mae to a buyer for.

Now…it is 7/1, and the facts have changed a bit. They are more or less the same, but now they have $60B of unsecured debt. How much would somebody pay for them now? Probably about $140B or so. So…you see, Treasury hasn’t managed to pull money out of thin air like they want you to believe…all they have done is get a payday loan, and diminish whatever value Fannie Mae had by another $60B and I’m not sure if it was positive to begin with….


**Edit**

Just wanted to say…you can make an honest case that the budget deficit has improved a lot over the last 6 months, or even the last couple of years. Now…I would argue that it’s temporary, but facts are facts, and there is no denying that after topping out in 2009 at $1.6T, the deficit has steadily dropped and will probably end 2013 between $700B and $800B…huge numbers still, but clearly dramatic improvement. Fine…make that case. What pisses me off though, is someone using these Fannie Mae payments as evidence of deficit improvement, despite the completely shady way the payment came about.
6/27/2013 Daily US Cash Deficit

By | Daily Deficit

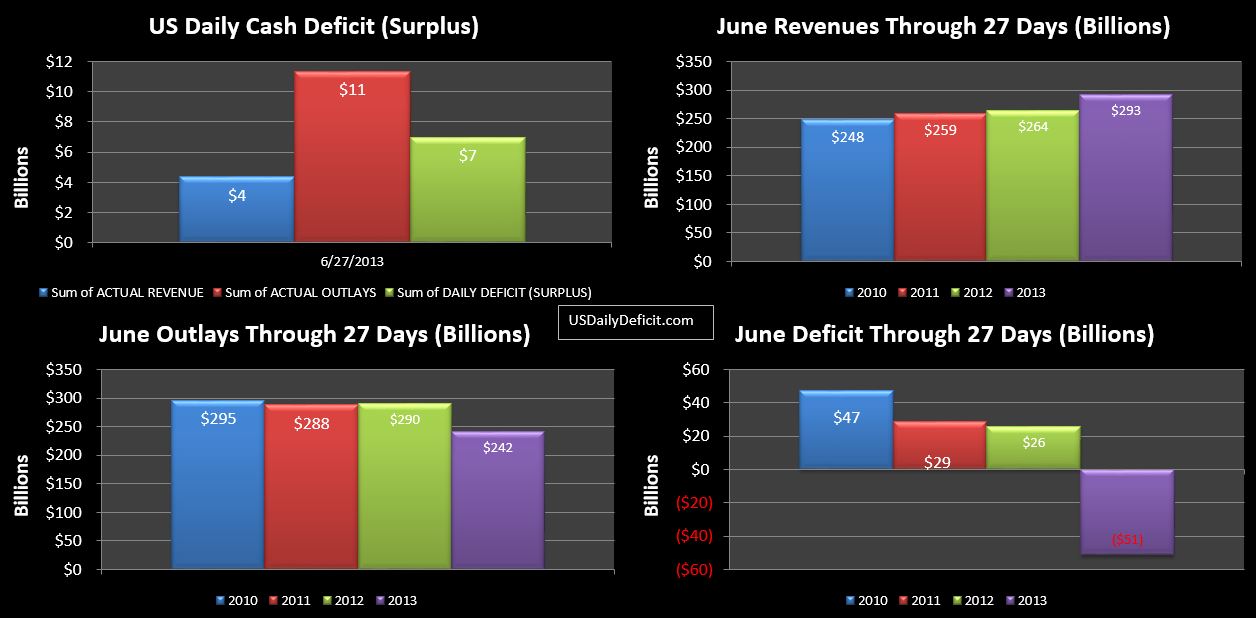
The US Daily Cash Deficit for 6/27/2013 was $7.0B dropping the June 2013 Surplus down to $51B with 1 day left.

06-27-2013 USDD

Tomorrow is going to be polluted with the extra 2012 payments and the Fannie Mae Funny Money in 2013, so this may be the cleanest shot we get at the fundamentals. So from this year’s 51B surplus, I would just subtract the $35B timing benefit to get down to $16B Surplus, a $42B improvement over last year. Not bad at all really. The real question is….what are we going to see next January. In theory, given constant rates, revenues should roughly grow in line with GDP and population growth…so maybe a few percent. If we are posting sub 5% YOY growth next year, lookout!!

6/26/2013 Daily US Cash Deficit

By | Daily Deficit

The US Daily Cash Deficit for 6/26/2013 was $8.7B….and was $3.8B on 6/25/2013, which I did not get a chance to post yesterday. With two days left the surplus is sitting at $58B for the month. With moderate deficits likely over the next 2 days, a $50B surplus would normally be a good estimate….not too shabby. However…supposedly a $60B or so payment from Fannie Mae is to be paid in June….though there seems to be no news on this for over a month. If it does happen, and I have no reason to believe it won’t…(it could be close to $70B with Freddie added in)…obviously the number could come in much higher…exceeding even my last guestimate of a $100B surplus by a healthy margin.

06-26-2013 USDD

Assuming nothing crazy happens(aside from the above)…never a safe assumption, Corporate taxes and withheld tax deposits are on track for 9% growth, while taxes not withheld appear to be honing in on +20%…a big swing from the -20% I was getting all worked up about last week 🙂

Social Security-Annual Change In Retired Workers

By | Commentary

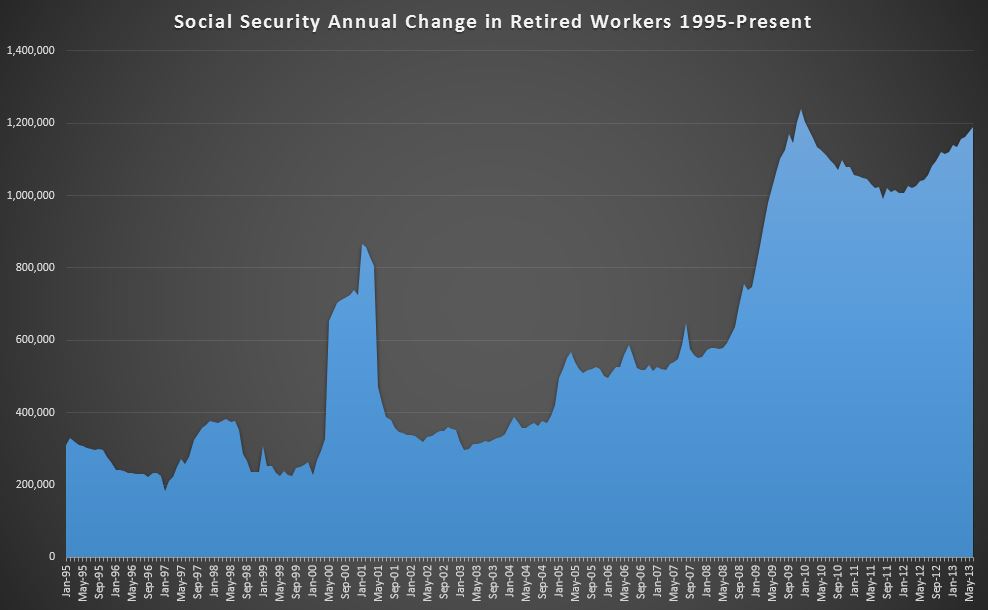
I know it was just yesterday I did a post on Social Security. Today…the SSA released  the June updates…among other things revealing that the number of people in the Retired Worker program increased  97k to 37.4M. This is not unexpected, though there is seasonality involved (more people seem to retire in Jan-Feb) 100k per month in additions is about where we are…though the trend is headed up. Just for fun…I charted the YOY additions (which eliminates the seasonality…and it shows a very interesting picture.

06-26-Social Security Beneficiaries

We start all the way back in 1995 adding about 350k people to the SS rolls a year. It moves around between  a 200 and 400k pace before spiking right around the dotcom  bust. After that it drops back around 350k before heading steadily up to about 600k per year in June 2008. Then…it takes off like a rocket topping out in December 2009 at an over 1.2M rate before declining back to about 1M at the end of 2011. Since then, we have seen a steady increase in the rate…likely driven by the demographics of Boomer retirement.

So the question is….what will this chart look like at the end of 2015? As we chug along in 2013 with a not so terrible economy, we are adding to the program at record rates and the demographics only get worse from here. Even a mild recession could cause a huge spike in early retirement…so just as revenues are being squeezed, we would start adding huge numbers to the Social security program. Just some quick math, adding 1.2M retirees, at $1,267 per month is about $18B per year. (I know yesterday we said $60B…that’s the entire program…not just retirees, and it includes the annual COLA on the entire population.) Each retiree… assuming the same $1267 payment and 20 years on the program….will draw in $304k of payments…ignoring inflation/COLA ect…

So… lets go out on a limb, and assume that of the current population of 37.4M, the average life expectancy is 13 years. (wild ass guess…got some 62 year olds and some 95 year olds). Pencil that out, and if we eliminated SS (retirement only) tomorrow for everyone not on it….we would still be on the hook for $7.4T…roughly (still ignoring inflation).Someday I’ll add in the rest of the population. But as we know…it won’t be eliminated….and there are 60M boomers waiting in the wings.