US Daily Cash Deficit 7/9/2014

By | Daily Deficit

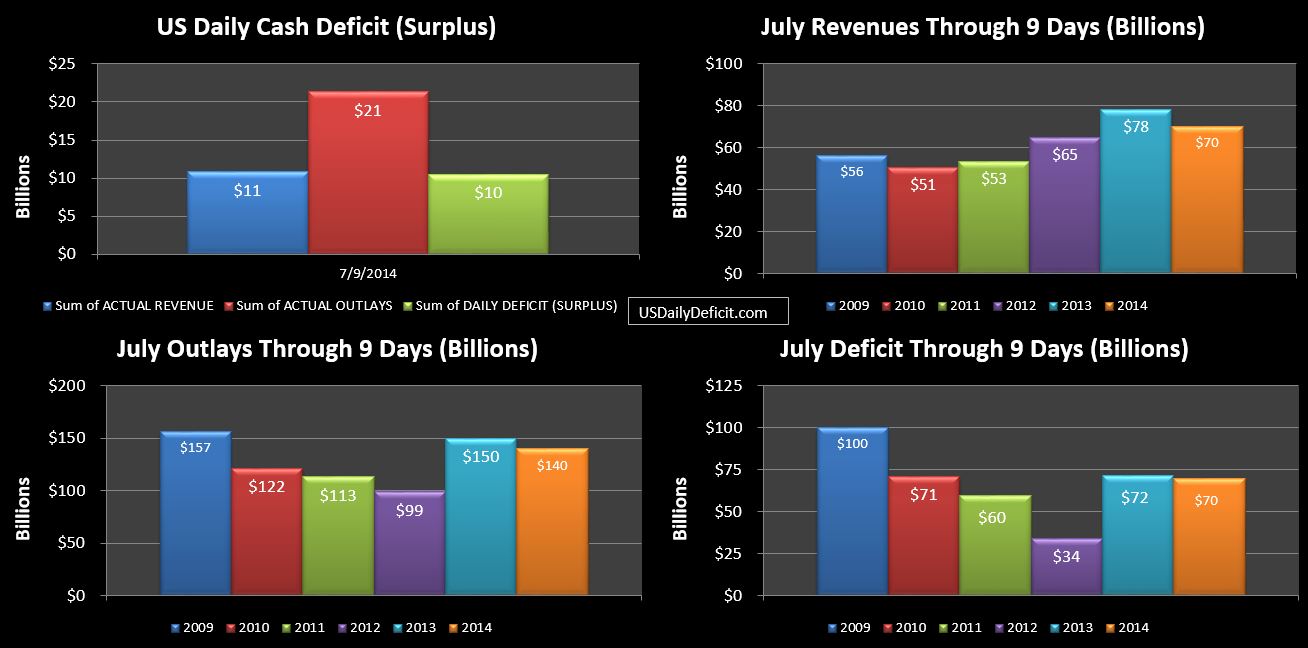
The Us Daily Cash Deficit for Wednesday 7/9/2014 was $10.5B, following Tuesday’s $6.5B deficit, bringing the July 2014 Deficit through 9 days to $70B.

2014-07-09 USDD

Revenues have gained a bit since the last report and now stand at $-8B vs 2013. Outlays have also gained a bit, leaving the deficit at $70B.  We’ll get some corporate taxes in next week…probably $5-10B, but other than that no big revenue events on the July calendar….To hit that magic +5%, all we need is to get to +$11B for the month, which is certainly achievable given that 2014 as presented in the analysis above has an extra business day remaining over 2013. Back of the envelope…$1B per day ought to get us there…stay tuned.
June 2014 Update: Social Security Enrollment

By | Commentary

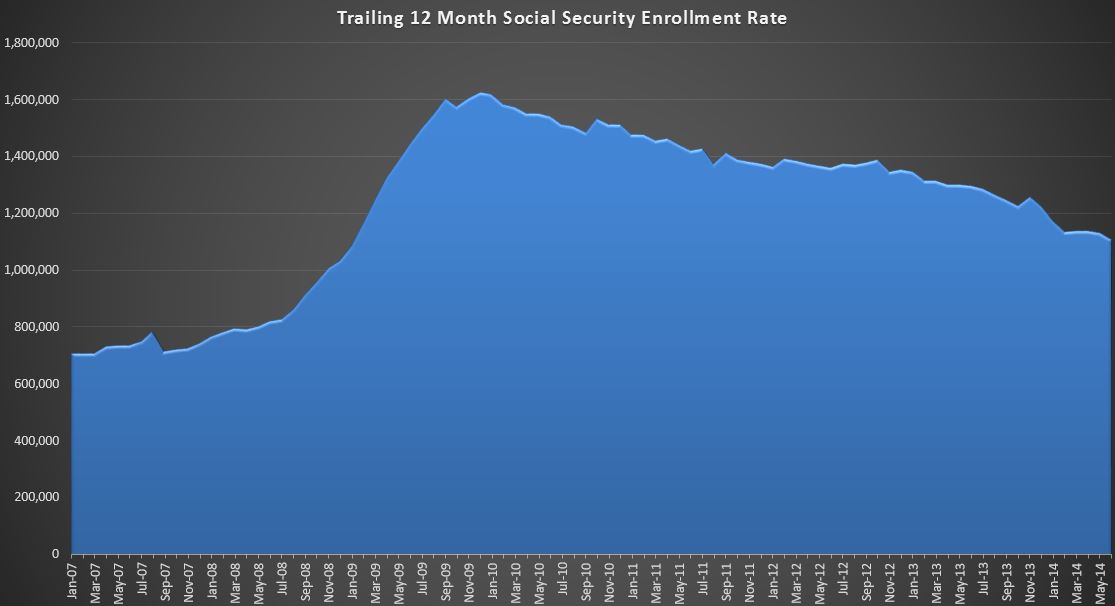
The June 2014 numbers are in and show an 11k drop in SS rolls….from 58.586M at the end of May to 58.575M at the end of June. This represents the first drop in nearly 4 years, but it isn’t a huge surprise. The truth is, June and July are seasonally weak months. I don’t exactly know why, but most of the change seems to be the categories related to minors…maybe graduating seniors get dumped off the rolls each summer?? Reductions in minors offset a 75k increase in retired workers pulling the overall population down. Last June and July came in at +13k and +3k respectively, so while a reduction in the rolls is certainly a good thing….it represents a 24k reduction in the annual rate of gain….that rate still stands at 1.106M.

2014-07-10 June SS Analysis

Perhaps the chart can add a little perspective. It’s certainly not bad news though. The 4 month plateau we were discussing last month looks like it is giving way to a continued reduction in the annual rate. There is a good chance we will see further reductions next month, followed by an uptick leading into the fall.

All in all…I don’t see any dire warnings in this data indicating a 2008/2009 spike is on the way….so Party On!!….for now.

US Daily Cash Deficit 7/7/2014

By | Daily Deficit

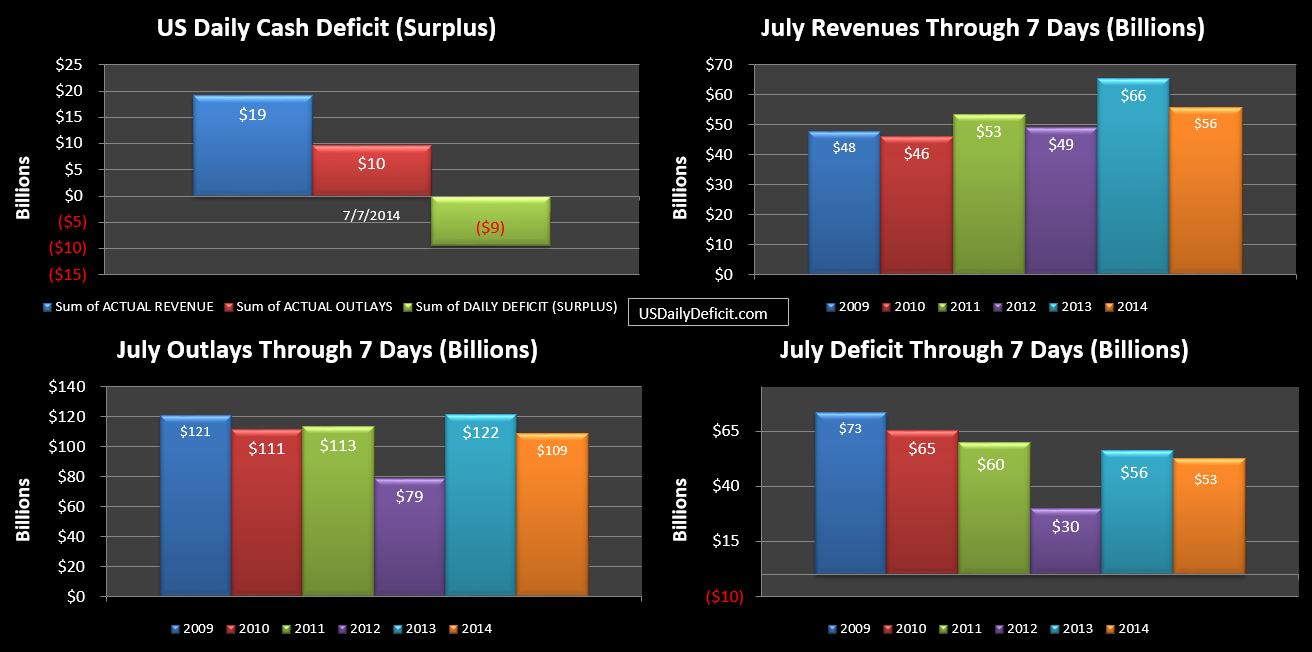
The US Daily Cash Surplus for Monday 7/7/2014 was $9.4B driven by strong revenues…typical following a long holiday weekend. This brings the July 2014 deficit through 7 days to $53B.

2014-07-07 USDD

Unlike last month, 2013 and 2014 don’t quite line up, so starting with the above chart I am syncing up on day of the week as has become standard practice. So we are comparing July 2014 through Monday 7/7 to July 2013 through Monday 7/8. As it stands, this gives July 2013 one additional business day…which is the primary reason revenues appear down ~$10B and outlays are down ~$13B. Not to worry….2014 gets the day back at the end of the month.

For now…keep your eye on the revenue hole…~$-10B and the pace we dig out of it(or don’t). Ideally, we would be at +$10B or so by the 30th….and whatever we pick up on 7/31 would just be gravy. That said, while I haven’t done any detailed daily analysis, it seems like we typically see our gains in the second half of the month…so if we are still sitting at ~-$10B mid month…we won’t have to panic…yet.

US Daily Cash Deficit 7/3/2014

By | Daily Deficit

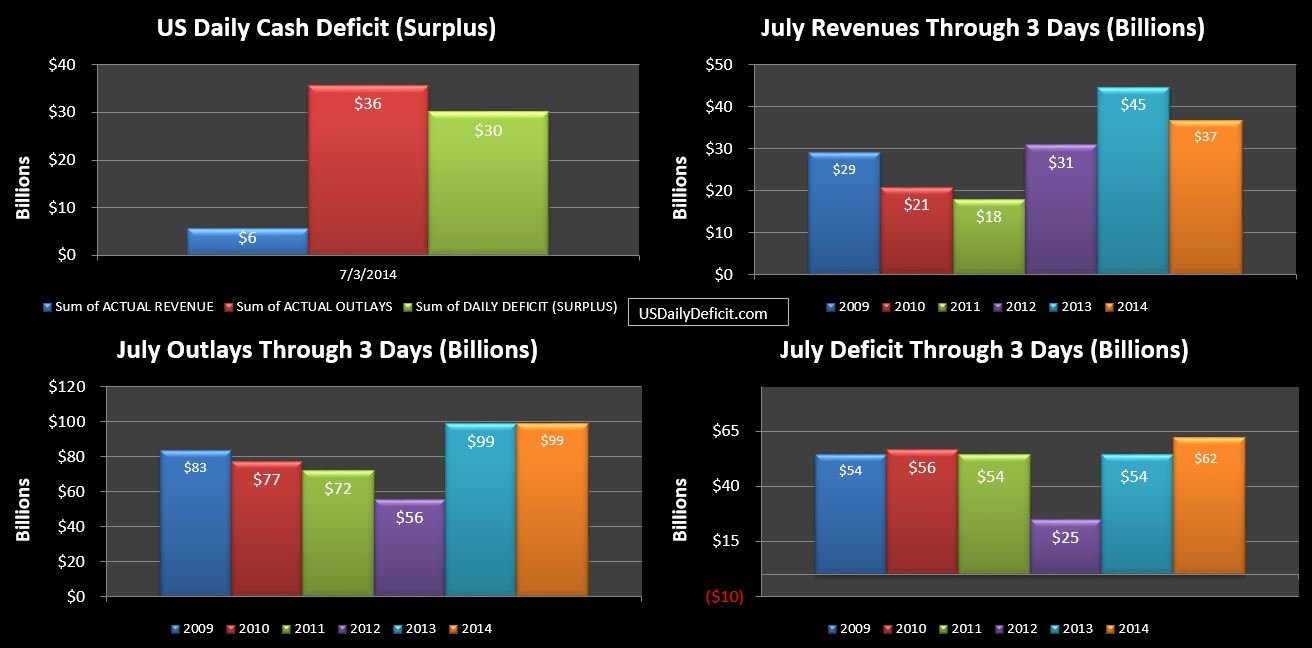
The US Daily Cash Deficit for Thursday 7/3/2014 was $30.1B, following a $6.4B surplus on 7/2 and a $38.4B deficit on 7/1. Add them all up and the Deficit through 3 days rings up to $62B….knocking out a big chunk of June’s $78B surplus in only 3 days. Nothing extraordinary about this…most months are heavily front loaded in outlays thanks to Medicare, SS payments, and other monthly outlays that typically go out in the first few days of the month. Still…it’s a bit sobering.

2014-07-03 USDD

Above is our first chart of the month….with revenues down $8B and outlays flat. Also note that this is completely unadjusted….3 days of 2013 vs. 3 days of 2014….I noted in my forecast post that July was at a bit of a timing disadvantage, and a big part of that is that it started on a Tuesday…which typically has weak revenues, especially compared to July 2013, which started on Monday…which generally has the strongest revenues. Regardless…2014 starts in a hole…and is going to need solid revenue growth for the remainder of the month to dig its way out.

It was just a few days ago that I forecasted a $60B deficit for the entire month…and yet here we are 3 days in at $62B. I’m going to stick to it for now though… In a few weeks the timing should start to even out and if revenue continues to show moderate growth between 5-10%….my forecast should be ok…..if….

July 2014 Cash Deficit Forecast

By | Daily Deficit

Let’s start out with a look back at June where my $85B Surplus forecast was $7B over the actual at $78B. Not too shabby….our model seems to have settled in and is giving us a +/-$10B range….though it is prone to an occasional bust like we saw in April(+55B).

July is a typical Deficit month…last year posting a $90B deficit on $220B of revenues and $310B of outlays. This year, I’m forecasting the July deficit comes in a bit lower at a $60B Deficit on solid revenue gains and outlays being down a bit…primarily timing of interest payments. Of course…the key here is cautiously optimistic revenue growth…if it comes in at 1% my forecast will be a bust.