US Daily Cash Deficit 8/1/2014

By | Daily Deficit

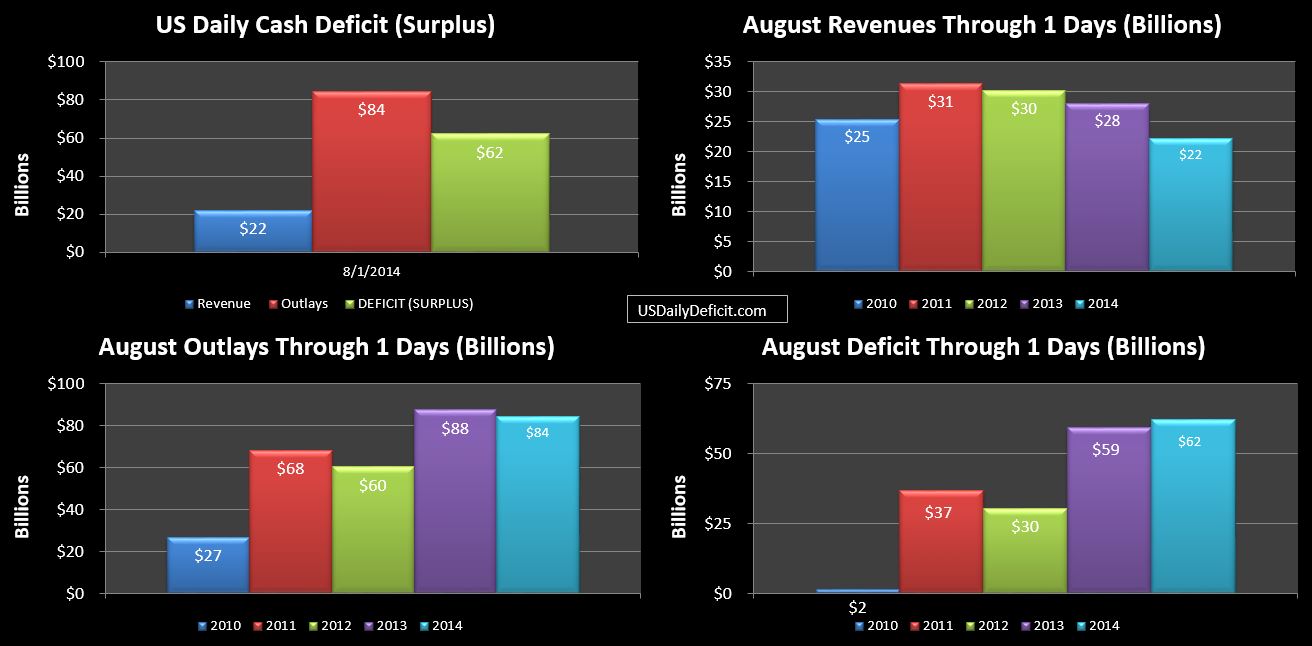
The US Daily Cash Deficit for Friday 8/1/2014 was $62.2B…a huge number, but actually typical for the first day of the month. In this case, $24B of SS payments due Sunday 8/3 went out early because of the weekend.

2014-08-01 USDD

For timing, as is typical, I am adjusting for day of week for 2014 vs 2013. So The chart above compares Friday 8/1/2014 to Thursday 8/1/2013 and Friday 8/2/2013. 2013 gets an extra business day from the start….and will finish the month with an extra business day, making revenues a little tougher to beat, and outlays a little easier.

We start the month $6B down on revenues and $4B down on outlays, good for a $2.8B deficit lead over 2014. Those are the numbers to watch. if we are going to hit +5% on revenues we need to get to about +$10B. It’s certainly possible, but given the one fewer business day and the overall slowing trend we’ve seen over the past 4 months, I’m not holding my breath.

US Daily Cash Deficit July 2014

By | Daily Deficit

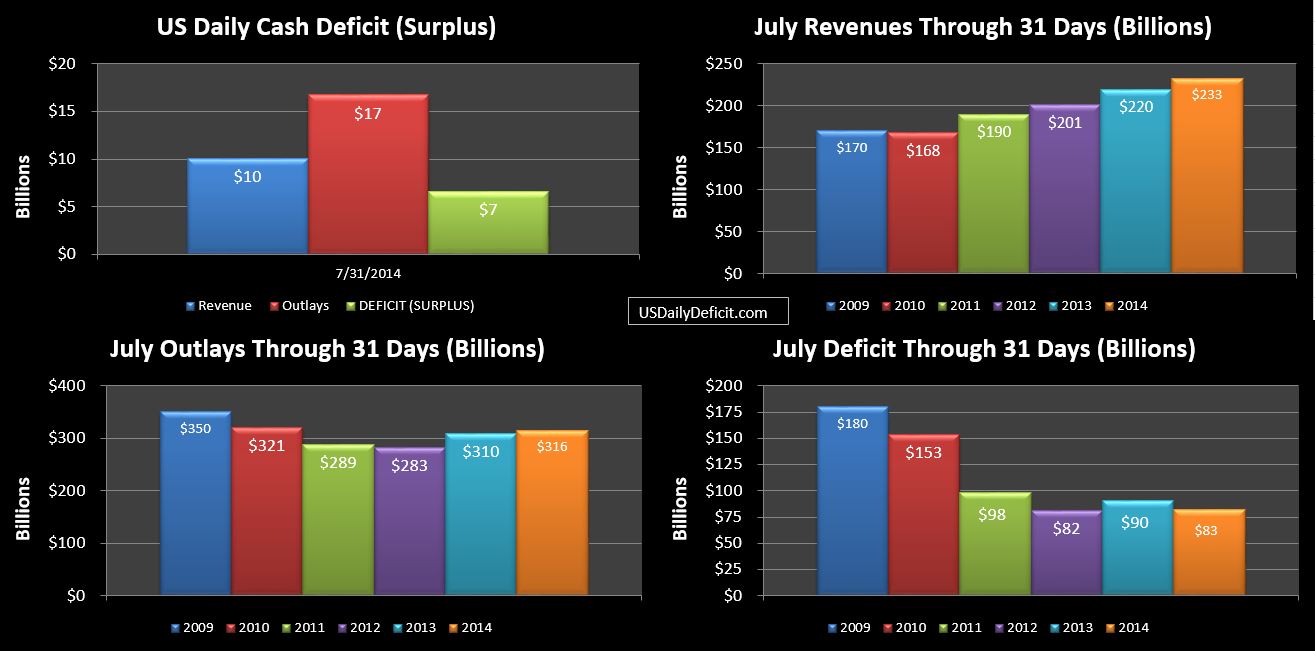
Looks like Treasury finally got the 7/31 DTS figured out and published…. The US Daily Cash Deficit for Thursday 7/31/2014 was $6.6B bringing the July 2014 deficit to $83B…just $7B under last July’s $90B deficit and $23B over my initial forecast of $60B.
2014-07-31 USDD

Revenues ended up at +$13.5B…good for a 6% gain. This was about $4B under my initial estimate….and about $8B of it came from one time items I didn’t forecast…suggesting the fundamentals are a bit worse. Indeed…withheld tax deposits actually ended up down a fraction at $164.9B vs $165.2 last July. This makes the third month out of 4 with flat taxes withheld…with June being the exception at +13%. Combined…the average of the 4 is +3.7%. In the long run…ignoring recessions…I would expect typical revenue growth of 2-3%….so we are certainly headed in that direction.

Outlays have been more or less flat for years now…with increases in SS, Medicare, and Medicaid being offset by reductions elsewhere.  This has made them fairly easy to forecast since we don’t see any wild unpredictable swings. Until now. While I only missed the revenue forecast by $4B…I missed outlays by $17B, $13B of which was related to Medicare and Medicaid. I’ve been discussing Medicaid for a while…and as expected, it broke the one month record….surging to $30.8B…an $8B and 36% increase over last July. Medicare was up nearly $5B YOY from $51.7B to $56.5B. I can’t explain it…maybe they got behind on accounts payable and finally caught up…causing the spike…this is a cash based report after all.  For now, I have to assume the magnitude of these YOY gains is just an anomaly…let’s hope so.

All together….the month was a mixed bag. Revenue gains of +6% are nothing to sneeze at…If I was in charge I’d be happy with that all day long. But…there was weakness….and those one time items will make it that much harder to post a decent number next year. I’ll give it another few months for final confirmation…but it is starting to become quite clear that the +10% revenue growth period we saw between 1/2013 and 3/2014 is over and headed back to a normal range….hopefully 5% or so, but maybe not. Outlays showed some signs of picking up…perhaps the most solid signal in 4-5 years of relative stability. We should keep an eye on it, but for now it’s just one data point.

Looking forward to next month….August typically has one of the highest monthly deficits posting $173B last year. I haven’t fine tuned my official forecast, but ballpark it’s looking like $160B or so. Doh!!
US Daily Cash Deficit 7/30/2014

By | Daily Deficit

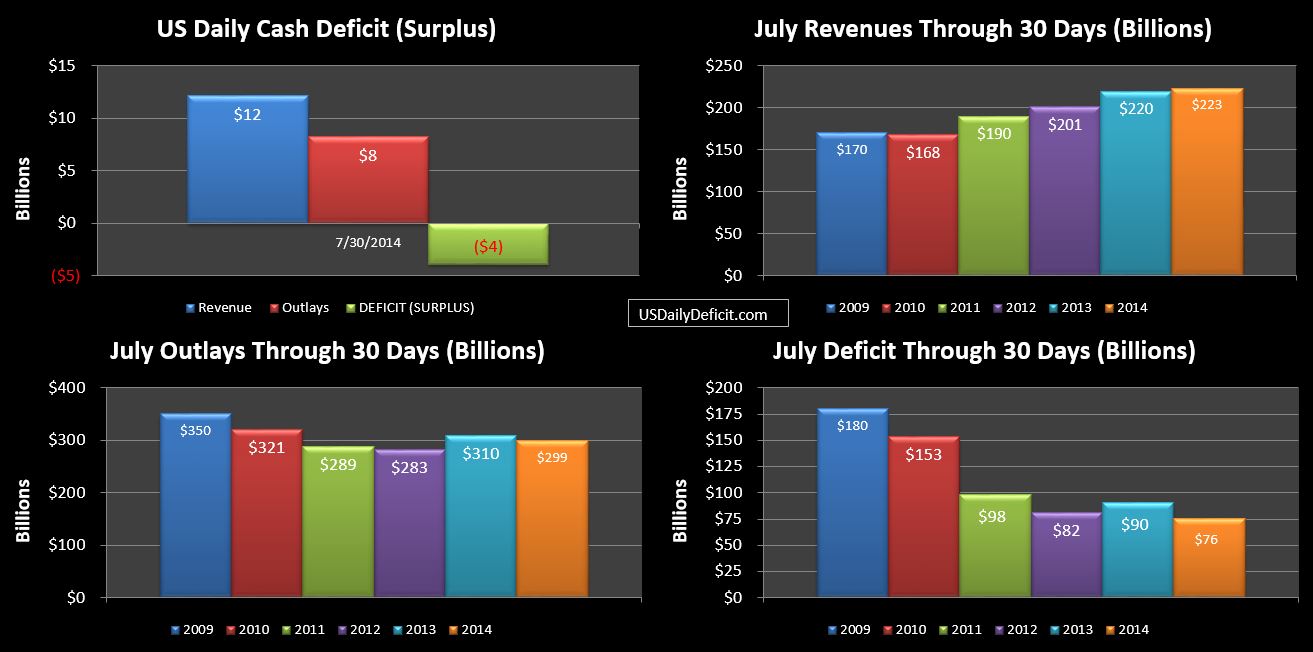
Well….I figured I’d have the 7/31 numbers in hand by now…but the DTS still hadn’t been published as of 4:45 EST…so I guess I’ll catch up on the last two days I missed instead. The US Daily Cash Surplus for Wednesday 7/30/2014 was $3.9B following a $2.9B deficit on 7/29, leaving the July 2014 deficit at $76B with just one business day remaining.

2014-07-30 USDD

Our chart above is comparing 31 days of 7/2013 to only 30 days of 2014 per our standard adjustment for days of week. So we are looking at prior year finals while 2014 still has one day left. Clearly revenue will be up…we are already at +3B….we’ll see how much flows in 7/31. Outlays look on pace to match last year despite a $-6B timing issue.

My initial impression of July 2014 is that it’s going to be an ok month….revenues will be kind of ugly, but up anyway due to some one time events. Outlays have some interesting movement…especially in Medicaid and Medicare that we need to keep watching…and hope these spikes are anomalies and not trends.


US Daily Cash Deficit 7/28/2014

By | Daily Deficit

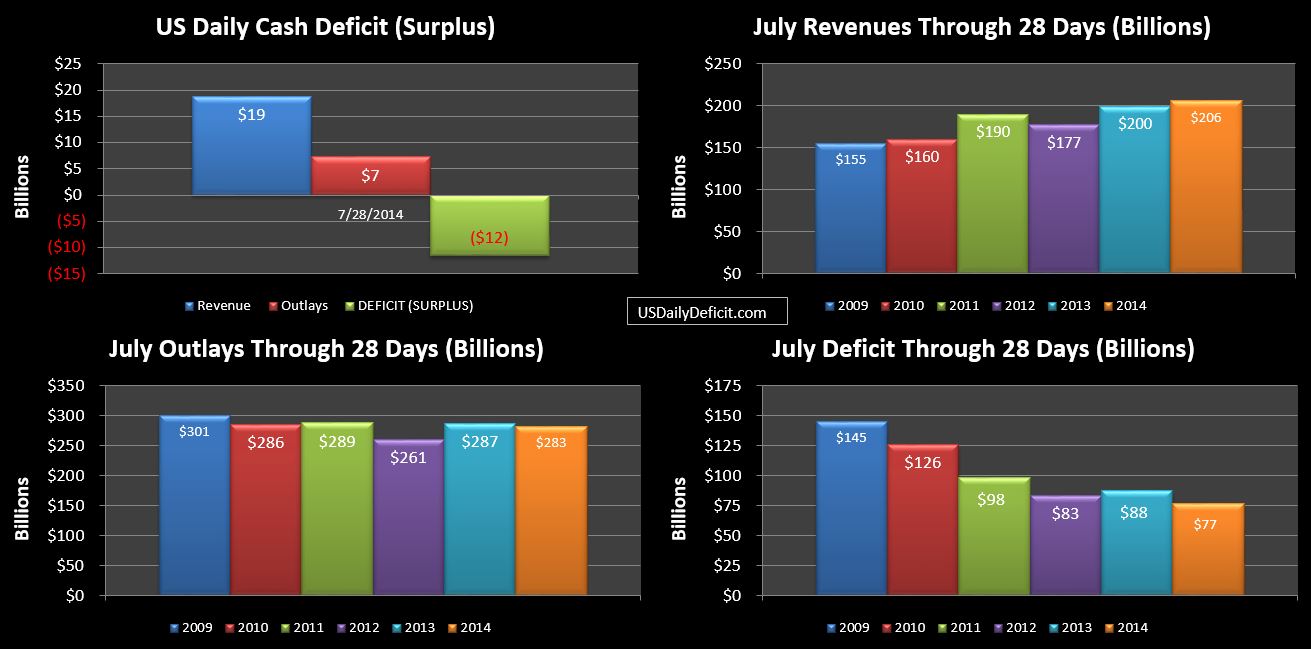
The US Daily Cash Surplus for Monday 7/28/2014 was $11.5B bringing the July 2014 deficit to $77B with 3 business days remaining.

2014-07-28 USDD

It was a good day for revenues thanks primarily to a $4.079B inflow from “Customs and Certain Excise Taxes”. It’s definitely odd…looking through my data…this one day payment exceeds every other whole month going back to 12/99 except one…12/2012…which came in $4M higher at $4.083B. I have no clue what it was…30 seconds worth of Google searches failed me (Obamacare fees??)….but clearly we will set a record in this category this month.

So revenue is sitting at +$6B…and looks like it should hit or exceed 5% growth for the month, but it is worth noting that taxes withheld are looking pretty flat….with all of the gain coming from one time events and corporate taxes. We’ll take growth wherever we can find it…but I’d prefer we saw it in stable categories.

US Daily Cash Deficit 7/25/2014

By | Daily Deficit

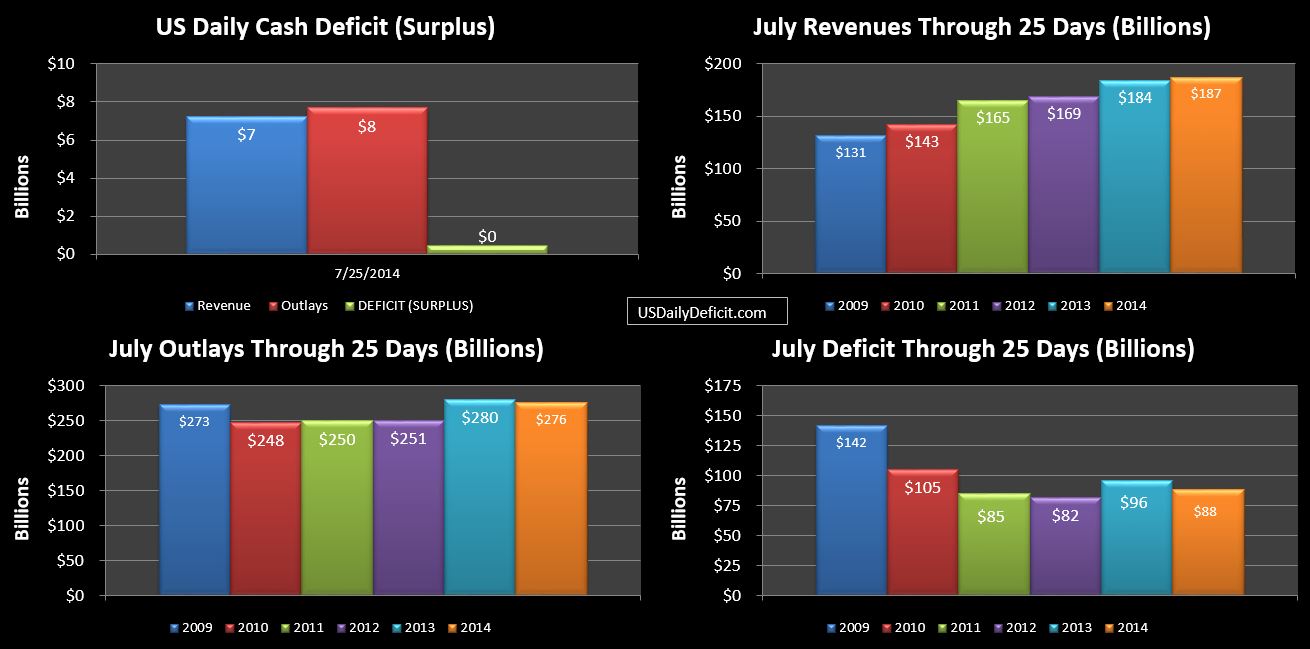
The US Daily Cash Deficit for Friday 7/25/2014 was $0.4B leaving the July deficit virtually unchanged  at $88B with 4 business days remaining.

2014-07-25 USDD

Revenues were down a bit and outlays were up. If patterns hold…we appear to be headed for an ~$80B deficit compared to my initial $60B guess. So what happened?? Outlays are surprisingly strong despite favorable timing…and revenues are under what I had expected, though they do seem like they may come in at about +5%