US 2018 Cash Deficit: $958B

By | Daily Deficit

2018 is now in the bank and it was pretty ugly no matter how you look at it….but first a quick look at December.

December 2018

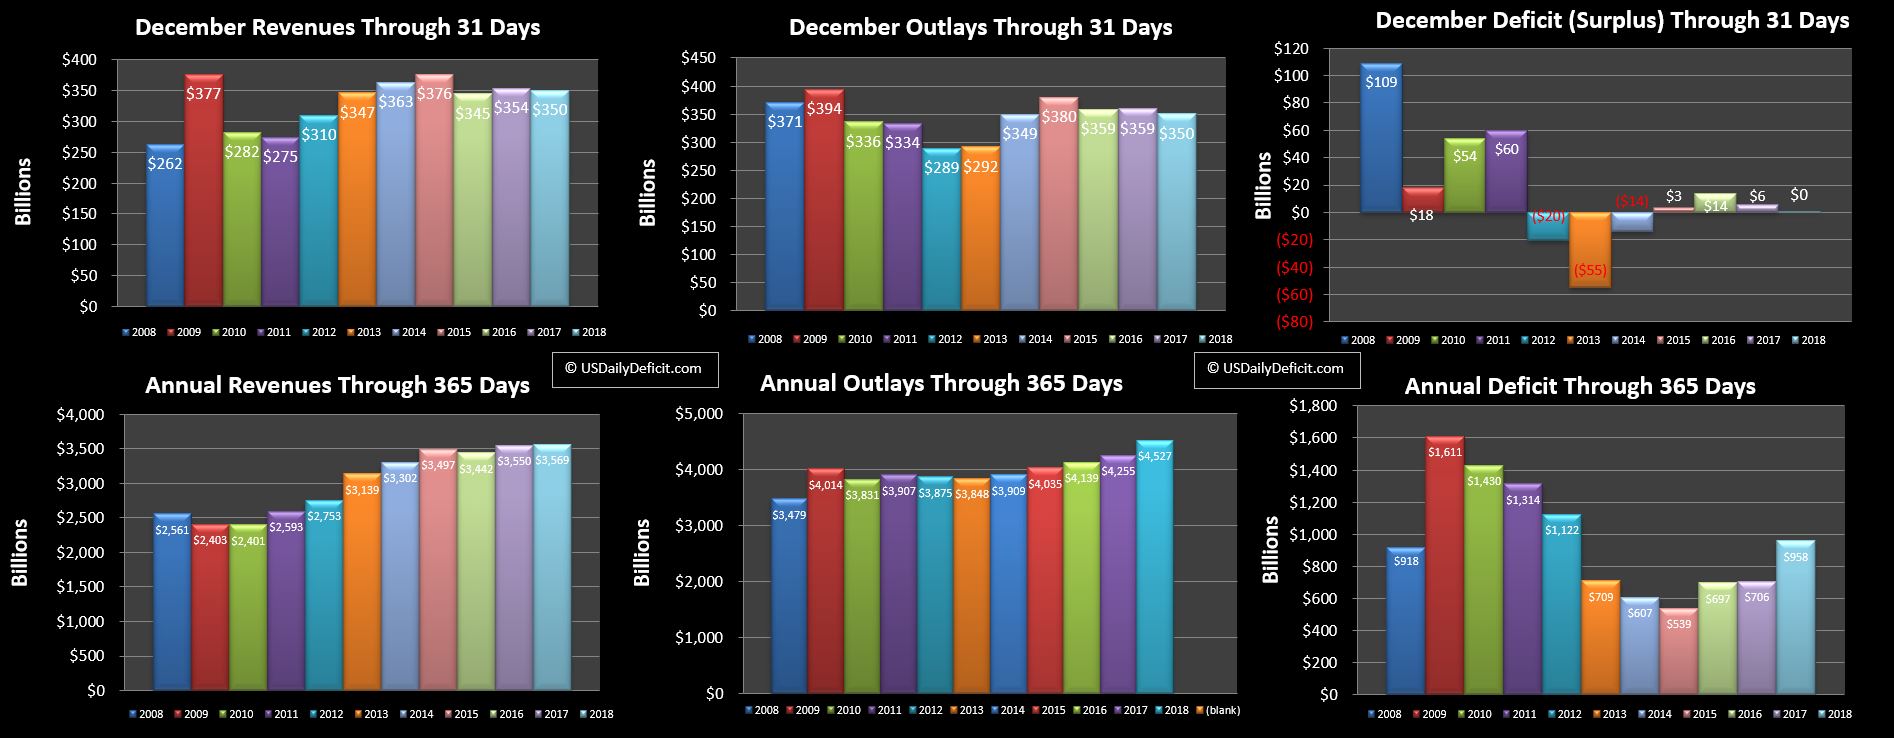
We entered December with a $958B deficit and I expected a small surplus of about $20B as the timing issues from last month rolled off, helped by strong December revenues we normally see at the end of a quarter. But it wasn’t to be….despite dumping $45B of cost into November, December only managed underspend 2017 by $9B…good for an adjusted $36B increase in spending…about 10%. Revenues were down $4B…again, not a surprise given the tax cuts but still not the right direction. Put it all together and while it shows up as 0 on our chart…December posted a small $83M deficit….$0.1B for fans of rounding….leaving the 2018 cash deficit unchanged at $958B

Revenues

Looking at the full year, revenues were essentially flat, up just $19B, or about 0.5%. That’s actually less impressive than it looks if you can remember April which posted a blowout $65B increase in revenue YOY….the last breath of 2017 pre-tax cut rates. Pull that out and we would have been negative 1.3%. But…it did happen…good for 2018, but when we start looking at 2019 YOY…it could get very ugly very fast, but who knows….

Outlays

Outlays were the surprise for me…up 272B on the year good for a +6.4% increase over 2017. In”normal” year….if there is such a thing…I would say +4%…which was my estimate 12 months ago, and will be my estimate for 2019 as well. Most of the increase is where you would expect….medicare, medicaid, and social security, but also interest was up big and growing fast as rates were increased…so expiring debt is being rolled into higher rates…for example 3 month yield started the year at 1.29% and ended it over 1% higher at 2.44%….and all of this is off lows nearly 0% not so long ago. Put the big boys together with increases across the board and +6.4% wow!!….

Deficit

$958B!! After bottoming out in 2015 at $539B…it has taken just 3 years to get back to the cusp of $1T again….which we will probably touch no later than this coming April with the TTM. Looking at the wayback machine I had forecasted a $980B deficit…no too shabby right!! However…I did miss on the internals…guessing outlays at +4% and revenues down 3%. Revenues ended up flat, and outlays were up 6.4%…still…I’ll take it!! 🙂

2019 Forecast

First off…nothing here is rocket science….with numbers this big….it’s really hard to see big swings….so I am going to go with outlays +4% and revenues +2%. Pencil that out and we should see the cash deficit grow $110B next year to $1.068T….growing at ~$125B a year beyond that….if we assume a nice steady state :)…not a bet I would take by the way….but a good reference point if you want it.

Default Near?

I asked this question last year….so we’ve made it another 365 days. Here is what I know…the debt is unpayable. Period. No combination of growth/tax increases could ever pay down this debt…much less pay it off….we are after all digging at a rate of $1T per year despite an economy that seems to be humming along ok with very low unemployment. What we can do…and what we have been doing for the last decade is continue to roll the debt at honestly…not so high interest rates as long as the market will allow….until the day we can’t…..in which case it could all get quite nasty over just a few months. Will that be 10 years from now as the debt closes in on $35T….or could it be this as soon as this year when it becomes clear Trump and Pelosi will not make nice? I don’t know….but I do know we are now 365 days closer to default day than we were last year….and our hand is getting worse by the day…..penny by penny. Throw in even a mild recession and that $1T could turn into $2T nearly overnight as Republicans and Democrats unite to increase spending and lower taxes. So is 2019 the year?…. It certainly feels a lot riskier than 2018, but to be honest…Hell if I know….stay tuned!!
 

US Cash Deficit November 2018: $223B

By | Daily Deficit


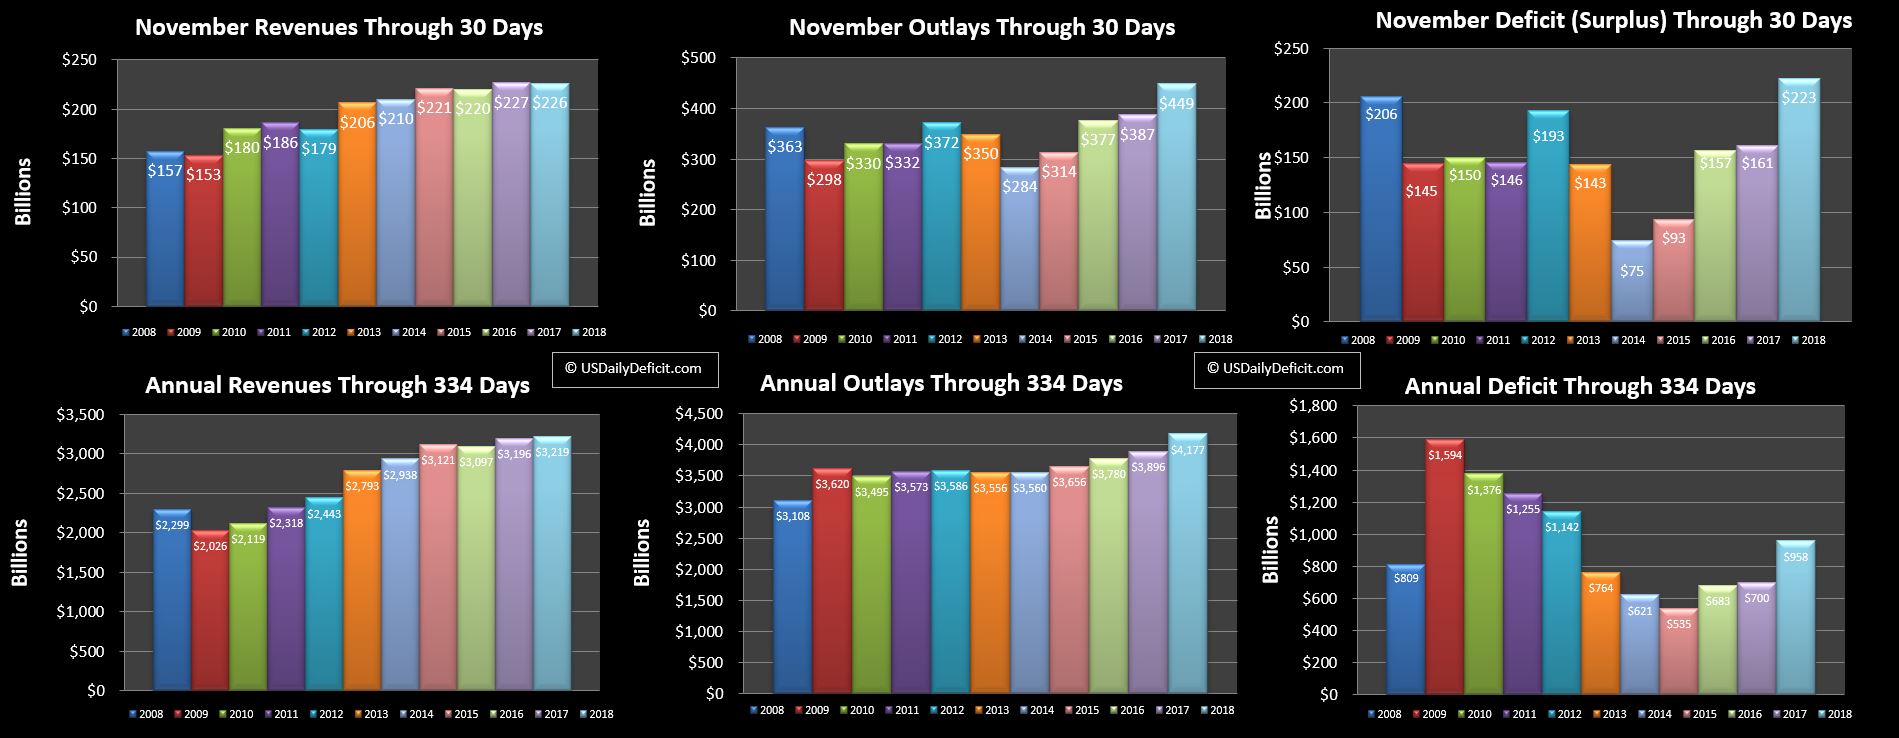
Well…I’m behind again…almost ready to drop the 2018 Full Year….but to do that I need to post something on November. So…Huge deficit number….$223B…highest I have on record…. and $62B higher than last year’s $161B deficit….let’s dig in.

Revenues

Revenues were essentially flat…which maybe we chalk up as a win given the tax cut YOY comps….not much to see there.

Outlays

+$62B….which pretty much explains the variance….and a good chunk of this is the month end timing…December 1 fell on a weekend, so a lot of outlays due 12/1 instead went out 11/30…about $45B or so. Not to worry…November’s loss is December’s gain…December outlays should be about $45B light all else equal.

Summary

I’m gonna keep it short here and move on to December….flat revenues with increasing outlays…even when we pull out timing…pretty much par for the course in 2018. Looking at the YTD…revenue is up a little less than 1% while outlays are up 7%. With one month left…don’t expect a lot of change…our timing issue will fall off in December and we should post a small surplus.

US Cash Deficit October 2018: $100B

By | Daily Deficit

Here we go with October….hoping I can get back to timely posting now that this issue is starting to heat back up.

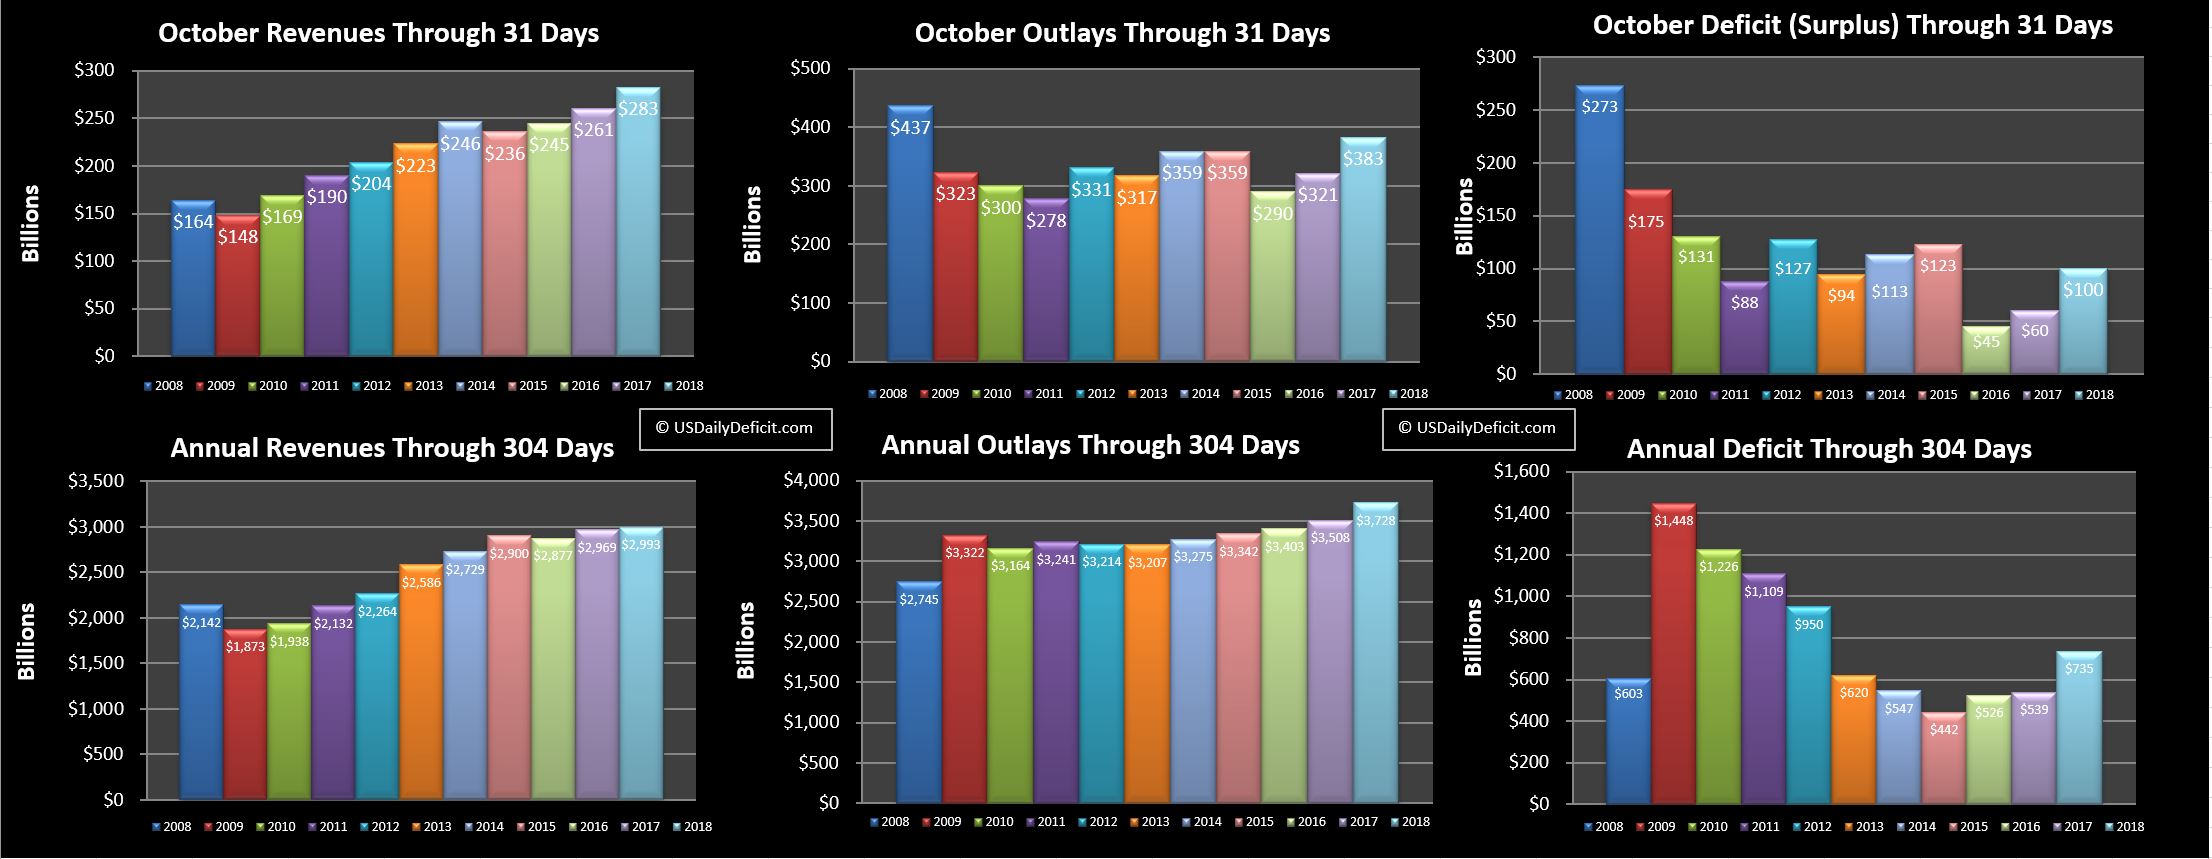
Cash Deficit was $100B….$40B over last year, though a good chunk of that is just timing issues getting flushed out.

Revenue:

On the revenue side…a nice surprise…+$22B good for an 8% improvement. Some of that looks like the extra business day and a pretty big increase in Excise taxes (Any chance the newtariffs are ending up in this bucket??)….regardless…this is a solid beat and the first in a while, so we’ll take it!!

Outlays:

Outlays were up big on timing, so best to look at the YTD…where we are looking at +6% YOY, which may not sound too scary, but it’s big….especially with flat revenues and a good chance next year hits the ground running at just a little less given a 3% COLA that is about to be pushed out along with increasing boomer retirements and soaring interest expenses…..plus who knows what kind of new spending Trump and the Democrats will come up with next year.

Summary:

Put it all together, and aside from a nice revenue boost, no real surprises here….it’s still just a slow moving train wreck. Revenues are flat YOY and will likely see YOY declines through April 2019 driven by tax cuts. Outlays are growing at around 6%….which feels too hot to sustain…but 4-5% looks possible. 2017 ended with a 700B cash deficit…2018 is honing in on about $900B-$950B….and while speculative, 2019 at $1.1T seems like a reasonable guess with a lot of unknowns.

November Forecast:

Looking forward…November is going to be a doozy…with low revenues and outlays up big on timing as payments due 12/1 will be pulled forward and paid out 11/30…look for a $200-$250B deficit. December however, should manage to swing a surplus since it will be light on outlays…maybe $50B or so in the black depending on how revenue strangth/weakness.

Stay tuned folks…we are on schedule to zip past $1T again by this April…possibly a bit sooner…..just in time for another debt limit fight. Popcorn??


August-September 2018 Cash Deficit

By | Daily Deficit

First…a recap….

When we last left off…we were seeing a pretty nasty trend….thanks in part to tax cuts and spending increases… for the May-July time frame we were looking at a 7% YOY decrease in revenues and a 7% increase in YOY spending….

So…let’s catch up by looking at August and September.

August:

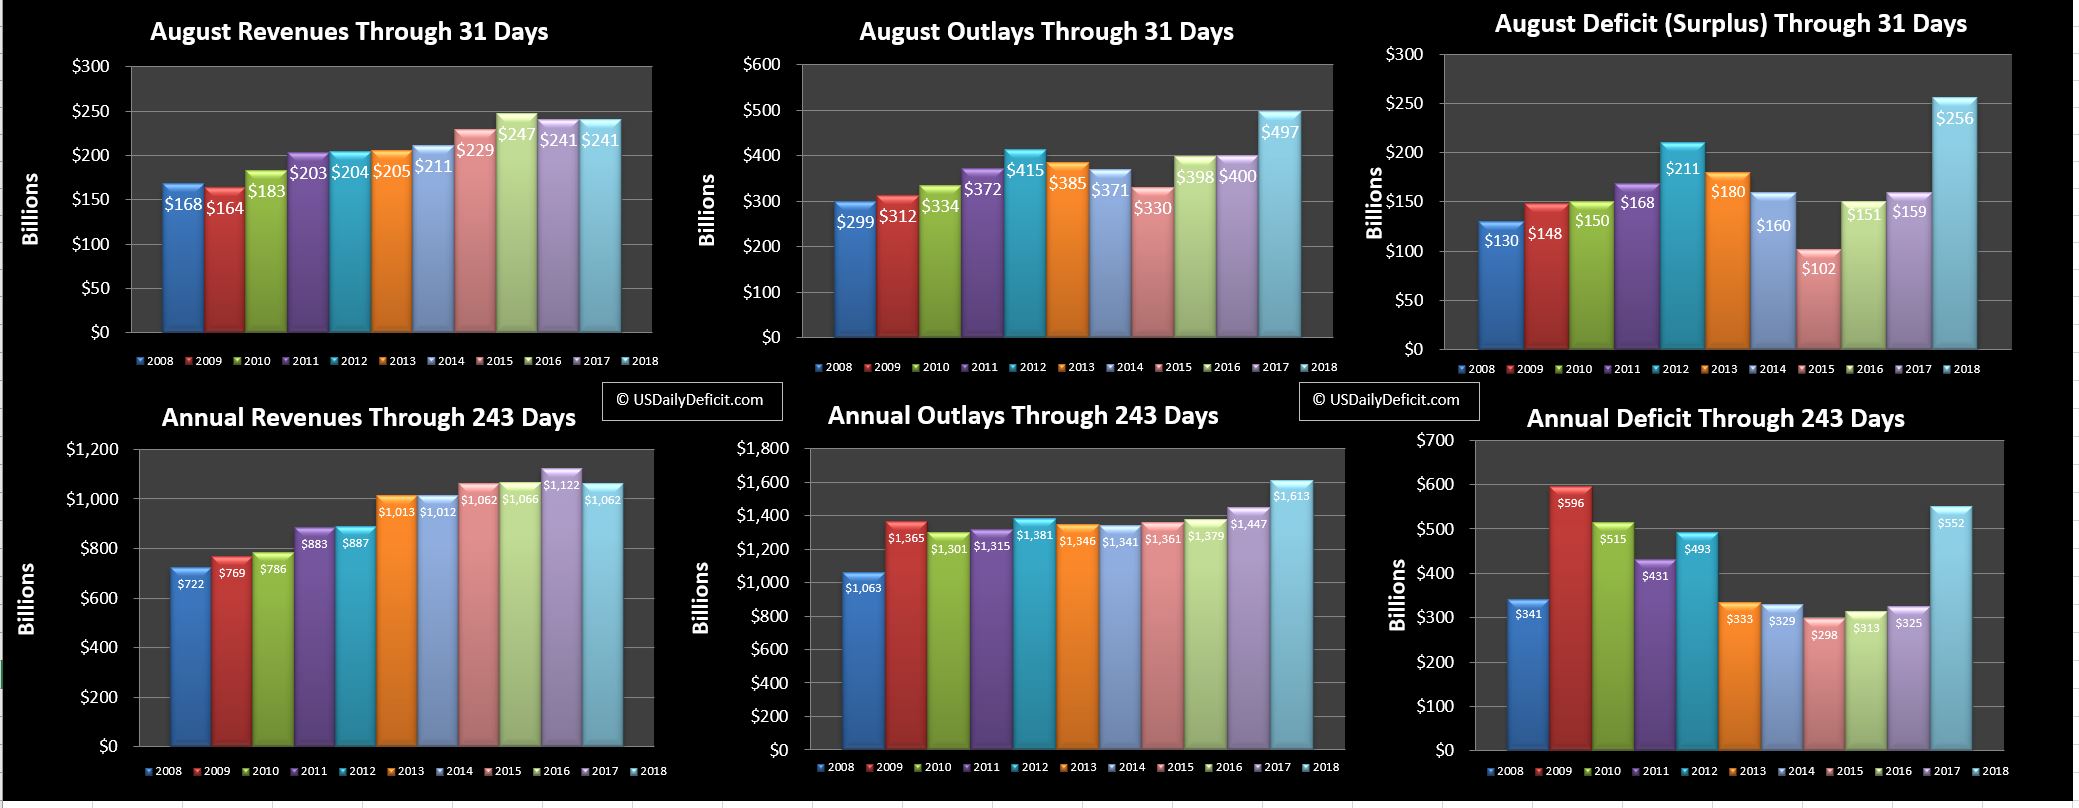
August revenues were flat….not great but way better than -7%. Outlays were off the charts….but a big chunk of that was timing…with September 1 being a Saturday, and September 3 being a holiday…a huge slug of costs that normally would have been paid in September got pulled forward and were paid 8/31. Augusts burden will become Septembers gain….remember that for below. The result is predictable… a 256B deficit…$97B higher than last year….but will it stick?

September:

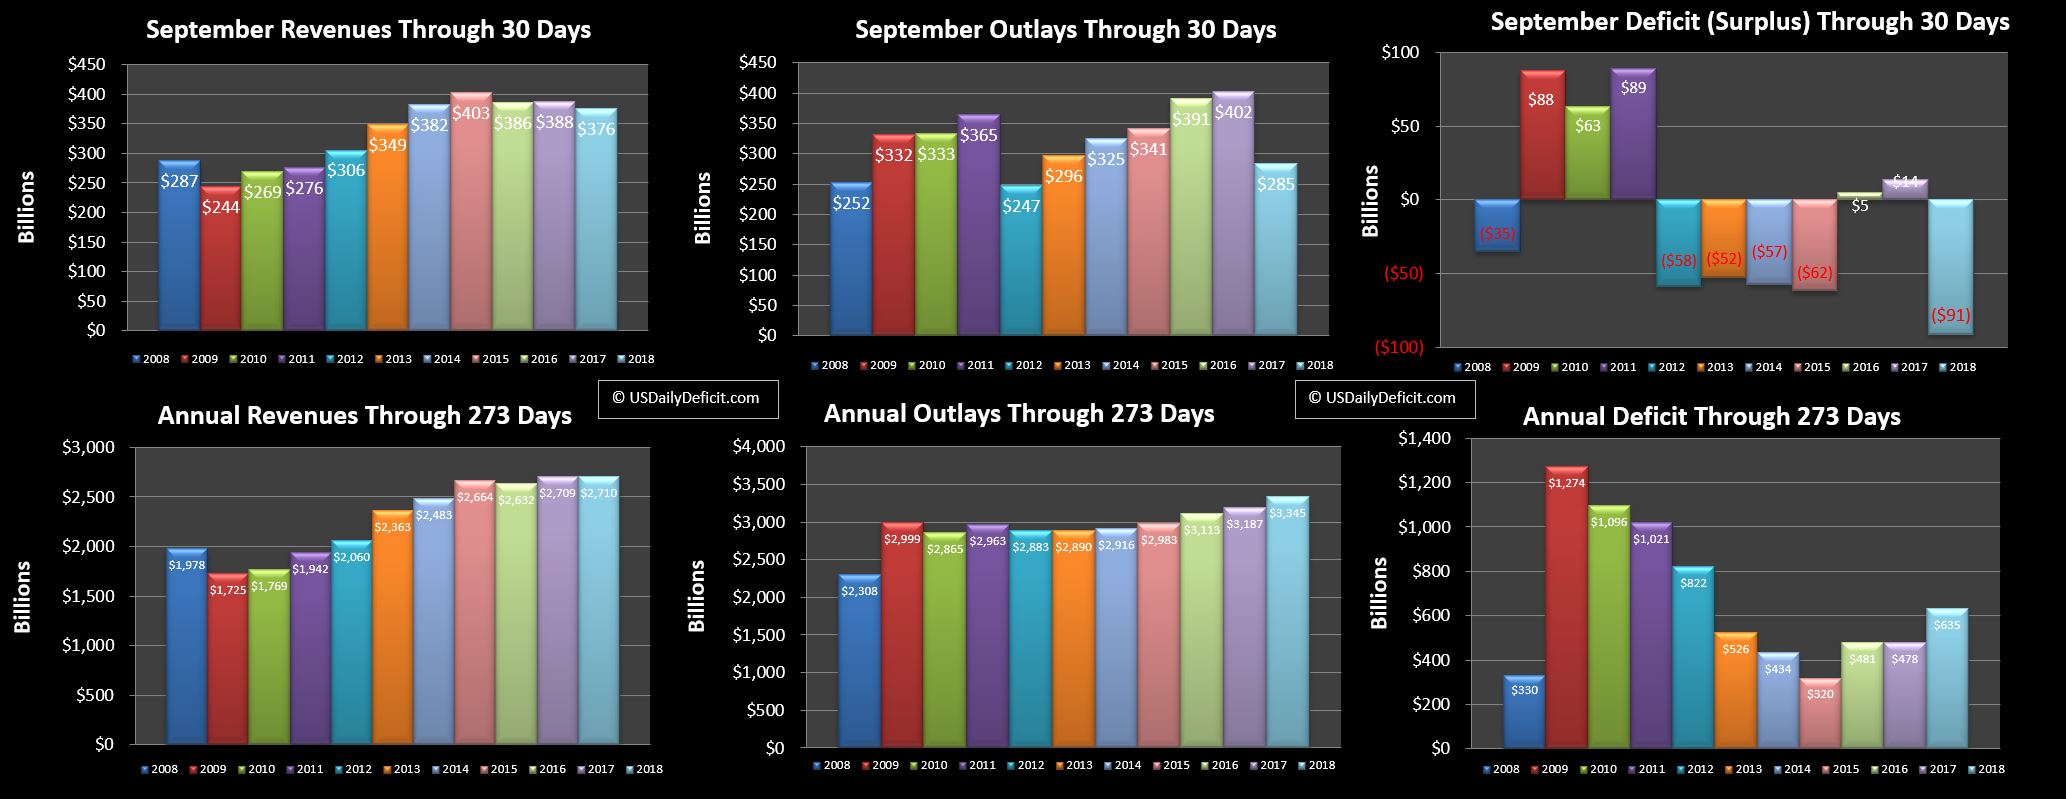
Revenues for September were down 3% not good, but still better than -7%. As expected….outlays are way down….about $100B of cost due in September was paid 8/31…pushing up August’s deficit and down September to a $91B surplus. In fact, we actually have a timing event going the other way for our YOY…September 2017 had some October cost pulled forward…this September did not have that issue…but no worries…by the end of October we should be more or less  back to even….at least for the YTD.

Combining August and September together to kind of wash out the 100B swings…we have revenue down about 2% and cost down about 3%…though again…timing. So…let’s have another look at May-September…we see revenues are now down just 5% compared to 7% for May-Jul, and costs are up just 3%, compared to +7% for May-Jul.

So…bad, but not as bad. No real shocks in these numbers….those +/- 7% were unlikely to hold up for the full year…and should more or less reset next May anyway…but the bad news is still with us…the deficit is trending up…it was $700B for 2017 and is zeroing in on $900B for 2018…with the trailing 12 month probably topping $1T in April 2019. For a history lesson…we dropped under $1T back in 2013…bottoming out at $458B in January of 2016. How long can this go on? I’ve given up guessing that, but we are clearly way past the point of no return. Interest rates are rising, Boomers are retiring, revenue is stagnating, and as soon as we get even a moderate recession….$1T will go to $2T in the blink of an eye. From here on out…it’s really just watching the Titanic go down…sad, but inevitable. Oh well…we might as well enjoy the band while it’s still playing.


Catch up (June/July 2018 Cash Deficit)

By | Commentary, Daily Deficit

So…I didn’t pick a great time to go AWOL….it’s a bit premature but the deficit picture seems to be getting worse by the week since May.

recall…April was a really good month with revenues up $65B and +14% YOY…a home run by any stretch, but my question back the was…Is this the last hurrah? My theory was simple…2017’s pre tax cut taxes came due April 15th…come May we would be seeing our first “clean” view of the tax cuts.

May came in worse than expected with revenue down $35B good for a 13% decline. Outlays were up about 3%, and combined with the revenue miss, the deficit for May was $49B higher than last year. Ok…one month does not make a trend…there are all kinds of ways a single month can get thrown out of whack with prior years.

Enter June:

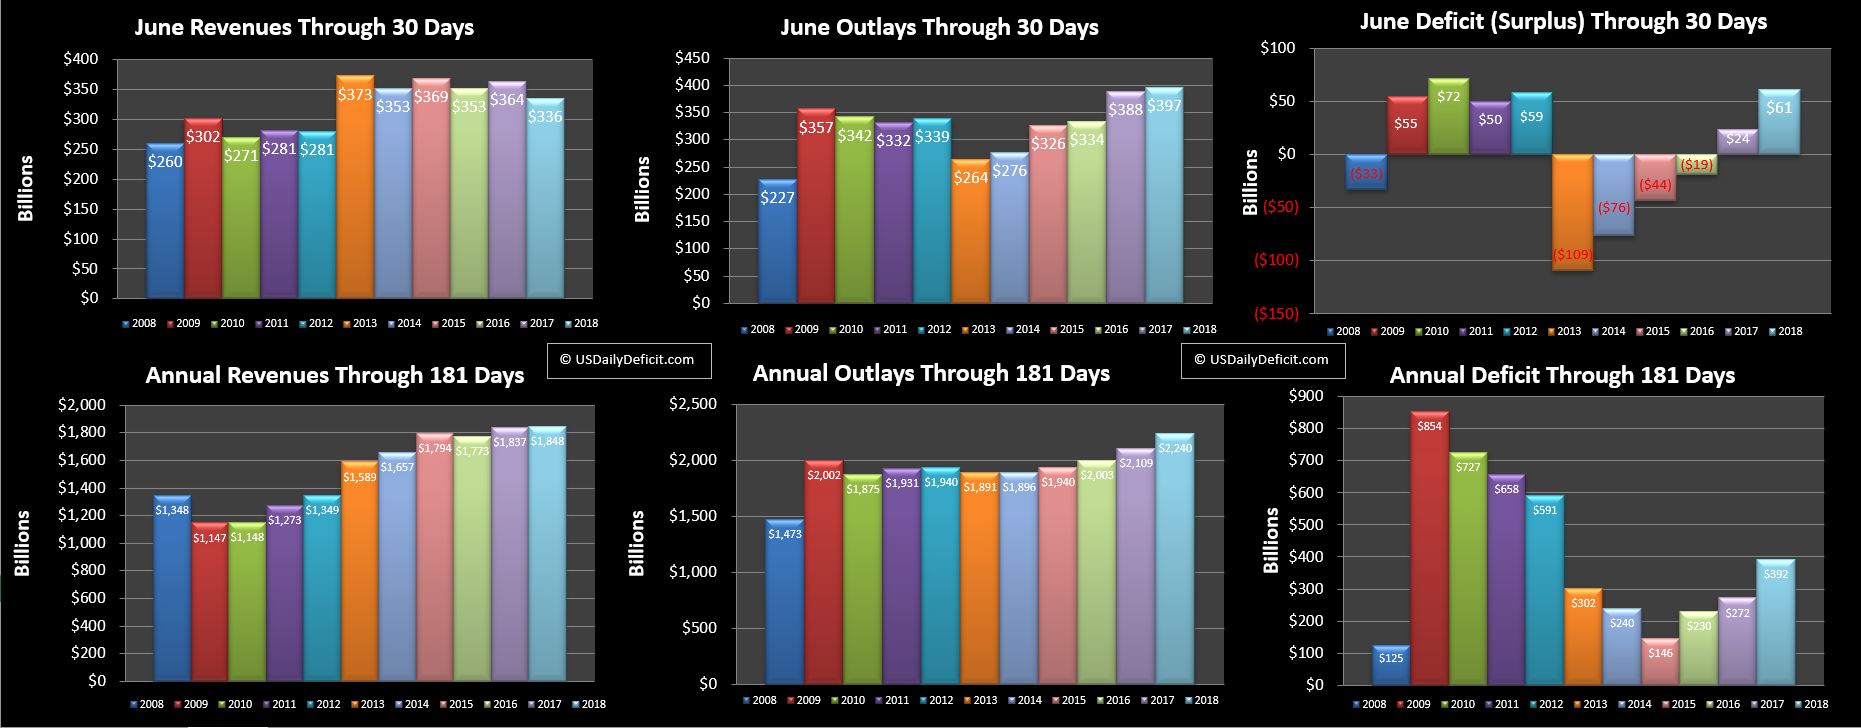
 Revenues down another $28B, an 8% decline with outlays up 2%, leading to a $64B deficit compared to last June’ s $24B.

Then July:

Revenues weren’t as disappointing…they were actually up $2B, but outlays were up $47B on some month end timing, putting the deficit up $44B (they don’t tie because of rounding).

So…my idea is simple…what if instead of looking at a fiscal year (Oct-Sep) or a calender year (Jan-Dec)…maybe we should instead be looking at May-April. It’s not perfect, but at least this year with tax changes…it may provide a little bit better picture of the YOY. So here goes:

Without digging in too deep… for the last three months, revenues are down 7% and outlays up 7%….and the deficit is up 80% from $166B last year to $296B.

Holy smokes!! That’s bad…maybe not as bad as it looks thanks to some timing issues in there, but it’s pretty bad. I don’t think those numbers stick for the next 9 months, but revenue down 5%, outlays up 5% sounds like a decent guess…September should provide some clarification. Now yeah, it’s kind of a one time event…all else equal next May we should see revenues get back to their ~2-3% growth, but by that time we should be well over $1T annual burn rate.

This isn’t my official forecast…but just to throw some ballpark numbers at you…Calendar 2017 ran about a $700B deficit, Calendar 2018 is looking like it will be around $900B, and 2019 could easily make a run for $1.1T. Throw in a recession anywhere any time and it’s not hard to see how we could jump to $2T virtually overnight.

Death Spiral Accelerating?

I’ve been following the deficit for about a decade and a half and blogging about it here since 2012, and a few years back it became clear to me that however slim the odds ever were….the window to avoid default had been passed and default was now inevitable….now it’s just a matter of watching for signs of a collapse.

Now timing…I have no idea…if you had asked me 10 years ago, I never would have dreamed we would make it this far…yet here we are…alive and well for the most part. In retrospect…perhaps the most critical enabler of this massive debt load was low interest rates. For close to a decade, rates were near zero, so as old debt expired, it was refinancedat super low rates….including the 30 which bottomed out at just 2.25%. Now…what kind of moron would loan Uncle Sam money for 30 years at 2.25%? Not this guy :)….but someone has it on their books.

And then…interest rates started rising. They still aren’t high….but every month now old debt is expiring and being refinanced at higher rates than a few years ago. Short term debt…once practically 0% is getting close to 2%, and longer term debt is edging past 3%. Still low historically, but when you are adding debt at $1T per year and refinancing Trillions more….each fraction of a % means just a little more debt on the camels back…day by day, month by month, year by year. We already know it is impossible to repay….now we are just looking for signs that the fuse has been lit.

Stay tuned….it’s starting to get smokey in here…