3/14/2013 Daily US Cash Deficit

By | Daily Deficit
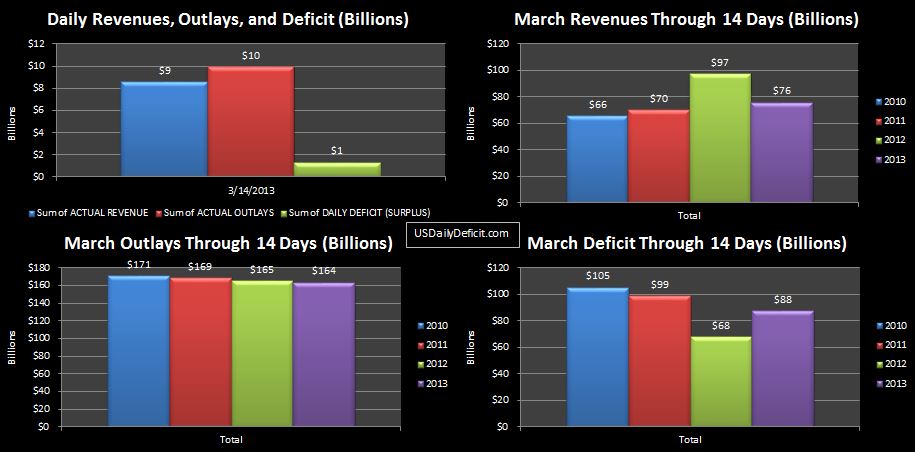
The US Cash Deficit for 3/14/2013 was $1.3B bringing the March Deficit through 14 days to $88B.

2013-03-14 USDD

 As expected, corporate taxes started trickling in…$4B, but 3/15 should bring a lot more…in the $20B range if last year is a guide. I wouldn’t be concerned about it yet, but through 14 days, 3/2013 is $2B under 3/2012 on corporate tax receipts…could easily just be timing. Other than that, the 3/2013 deficit is $20B over 3/2012 due to 2012 revenues from TARP and GSE MBS that have dropped off in 2013. Tax deposits are up by $6B, but this has been offset by a $6B increase in tax refunds. Outlays are pretty much flat.

3/13/2013 Daily US Cash Deficit

By | Daily Deficit
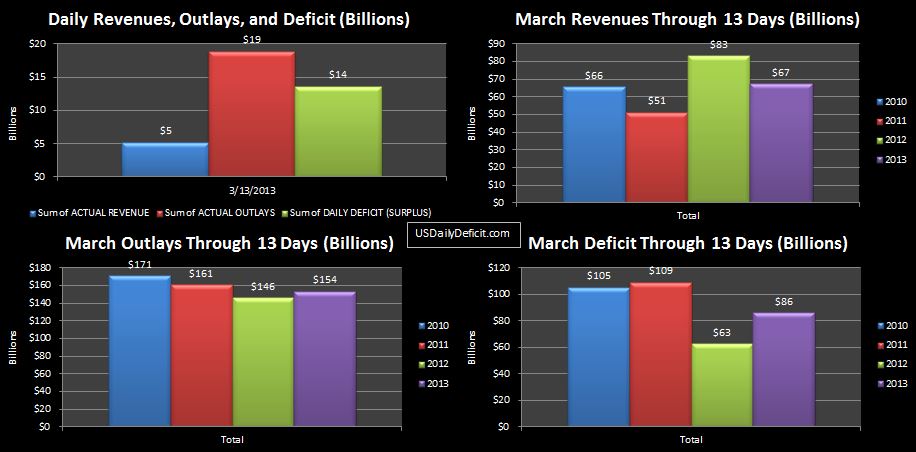
The US Cash Deficit for 3/13/2013 was $13.7B bringing the March Deficit through 13 days to $86B.

2013-03-13 USDD

This is getting interesting…13 days in, and 2013 has a $23B higher deficit, including $16B in lower revenues? At first I thought maybe I had a data error…but no…the numbers are correct, I just overlooked one more revenue source from last year…TARP…that has fallen off a cliff. Last year, through 13 days, Tarp had pulled in about $12B of cash. 2013…only $1B. So between TARP, the GSE MBS Income, and increased tax refunds (delayed from February), that’s about $30B of negative YOY revenue variances….offset by about $14B of higher tax deposits thanks to the tax increases and higher employment. We can chalk most of the higher cost up to timing of SS payments….that will sync back up tomorrow.
I won’t say it is likely yet, but it is certainly looking possible that the 3 month streak of YOY improvement gets broken, even with some favorable cost variances at the end of the month. The variables to keep an eye on are tax refunds and tax deposits…If we continue to see improvement in tax deposits, including corporate taxes we’ll see by next week, the streak could hold on for another month. If, however, tax refunds continue to outpace last year, growing from $10B delta to $20-$30B…that’s going to be tough to overcome.


3/12/2013 Daily US Cash Deficit

By | Daily Deficit
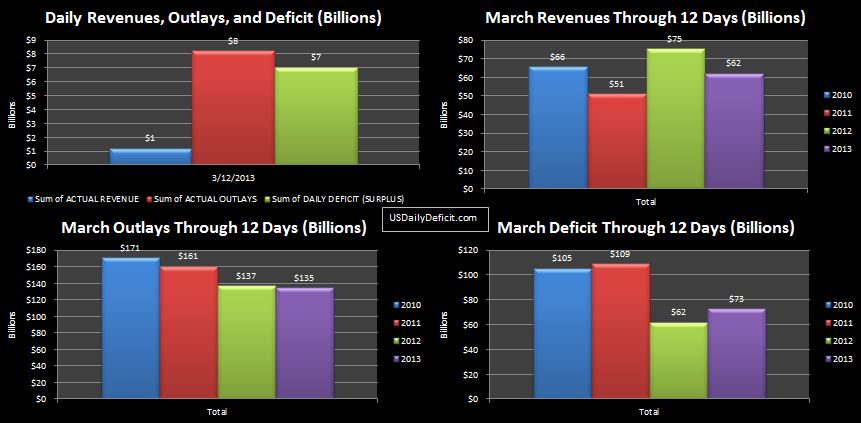
The US Cash Deficit for 3/12/2013 was $7.1B bringing the March Deficit through 12 days to $73B.

2013-03-12 USDD

Hmm… As expected, the GSE MBS Purchase Program Income payment of $10B counted in 2012 revenue has not come through again for 2013, resulting an a pretty big swing from yesterday’s YOY. Other than that, the two years are about as aligned as they are going to be until the end. Costs are flat and excluding the GSE income, we are pretty flat on revenue….increases in tax revenues are being offset by increased refunds. I am still expecting a YOY improvement…March 2012 had about $25B of April Payments pulled into 3/31 due to the way the weekend fell….2013 will not have this issue…those payments will go out 4/1, resulting in a favorable YOY timing issue that will work itself out in April. We still have a lot of days left in March, but through 12 days, we definitely are not seeing huge improvements YOY, or any improvement….which is going to be necessary if we are ever going to  materially break through this $1T per year deficit paradigm.

3/11/2013 Daily US Cash Deficit

By | Daily Deficit
The US Cash Surplus for 3/11/2013 was $3.2B on strong Monday revenues. The March 2013 deficit through 11 days is $66B, starting to show some divergence from 2012, but I suspect this will go away tomorrow when the 2012  GSE MBS Purchase Program Income discussed yesterday shows up in 2012, but not in 2013. (unless it does!!)

2013-03-11 USDD

It is also worth noting that 2010 and 2011 had two additional business days over 2012/2013 through 11 days, and already had their 2nd round of SS payments go out. March 2013 refunds are running $5B over last year…not a huge variance yet, but possible evidence that they are catching up on processing refunds.

Excel 2013 First Glance

By | Commentary
I have been wanting to try out the new release of Office, so when I found out I could get it for $10 through Microsoft’s Home Use Program, I decided to skip lunch and take it for a spin. At first glance, it is not very visually appealing compared to Excel 2010. Microsoft says it looks “clean”. I think it looks ancient. In fact, it reminds me a lot of excel 2000, which I had the unfortunate pleasure of playing with about six months ago. (we’ve come a long way) So immediately, I am thinking…I don’t like it. To be fair, this is a spreadsheet, not a luxury sedan, looks should be irrelevant, but remember…this is my first impression…what I am thinking when I open it up for the first time.
Some installation notes….after signing up and paying, they send you a link. You click on the link, and it automatically starts downloading a 500+mb file. I was expecting a wizard…and at some point to be asked if I wanted the 32 bit version or the 64. I wanted the 64, but am pretty sure 32 was installed, which isn’t a huge problem, at least not for now. Also, I had expected it to uninstall 2010….it did not. That turns out to be a blessing, since I can still use 2010 until I am satisfied 2013 is going to be worth learning. It did do one neat thing…it pulled all of my quick access toolbar icons from 2010 and put them in 2013…saving me about 10 minutes digging through the thousands of available oddly names links to get the 25 or so I really need.
So moving on…we already know it looks primitive and somehow I managed to install the wrong version…how does it work? Well…it’s a lot like 2010, but supposedly with a lot more bells and whistles. I read through Microsoft’s brochure, and nothing really jumped out at me as particularly useful, but you never know. Odds are, I’ll find a few neat tricks here and there over the next few weeks…in the meantime, I do have one more complaint. I use a lot of pivot tables, and in 2010, when you get to the “Pivot Chart Tools” menu, it has 4 options. Design Layout Format, and Analyze. 2013 is missing the Layout option, which has shortcuts to a ton of pivot table features that otherwise require a lot of clicks in the right spot to get too…I use it a lot, and it’s gone…so that kind of sucks. Maybe I’ll find them somewhere else?? For now, since I have the option, I will probably continue using excel 2010 for all of the analysis and charts I create for the blog….
If you recall, my first thoughts on Windows 8 were that I despised it…so this is a step in the right direction. Seriously though…it looks like crap…I can’t emphasize that enough.