4/22/2013 Daily US Cash Deficit

By | Daily Deficit
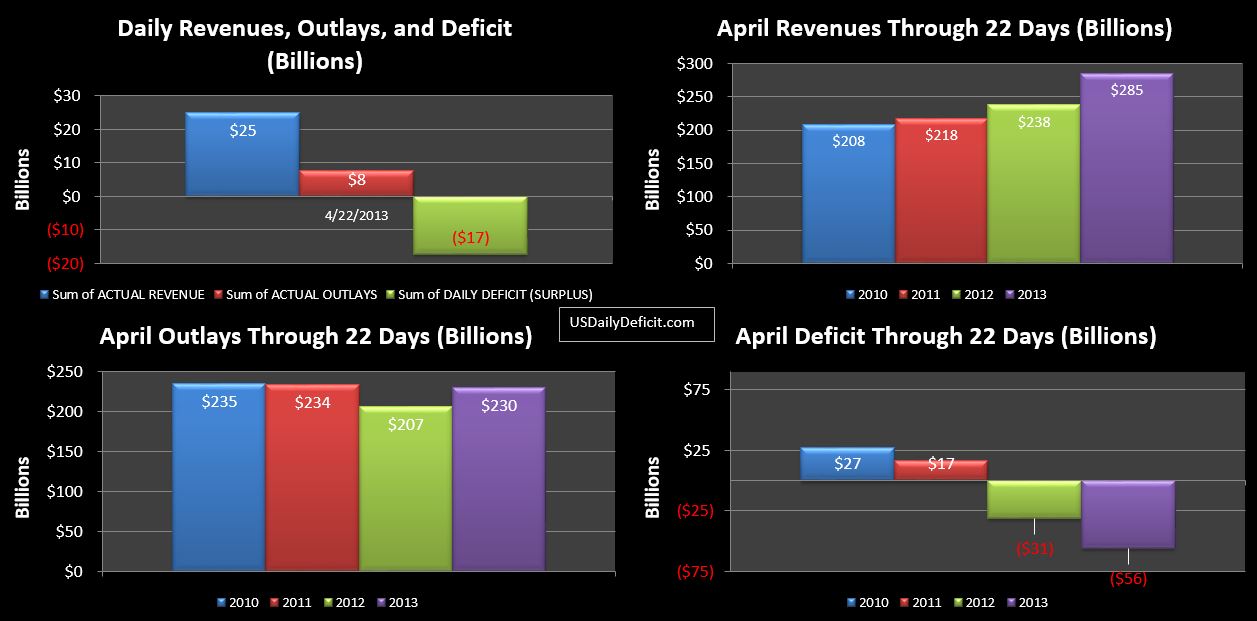
The US Daily Surplus for 4/22/2013 was $17.3B…an impressive number in it’s own right, but more or less in line with last year’s 4/23/2012 Surplus…. taking a breather from the 20%+ YOY gains we have been witnessing in some categories.

2013-04-22 USDD

This kind of illustrates the challenge I expect to see in 2014. Without a doubt…as far as tax revenues are concerned…last week was a blowout with many categories exceeding YOY by 30% or so. As impressive as it is….it is extremely difficult to maintain that kind of exponential growth beyond a cycle or two because you have to keep growing an ever expanding base. So while we very well may end April 2013 with 15-20% revenue growth….driven by several factors including a tax hike… seeing that repeat again in 2014 would mean something like an additional $50-$75B over an already impressive April 2013. I’m not holding my breath…
So here we are through 22 days of April 2013 with a $56B surplus. There is still a little uncertainty, but $100B appears to be in reach, but by no means certain.

“Data Shift to Lift US Economy by 3%”

By | Methodology
I thought this was funny. Apparently, the Bureau of Economic Analysis (BEA) is changing the accounting methodology for GDP to add a few new categories that will have the effect of increasing GDP by a few %. Here is the money quote:

“…so we are essentially rewriting economic history” – Brent Moulton

Isn’t that hilarious? Look…All you really need to know about GDP is that it is a completely bogus number…and yet…the pursuit of GDP is the dominant focus of nearly all economic policy. This error is responsible for a huge misallocation of global resources…but I digress.
In 1982, nominal US GDP was $3.3T…30 years later in 2012 it was $15.7T almost 5 times higher. So…think back to 1982…are you 5X better off? Are you any better off? Is the nation any better off? Sure…some of that is inflation, and population growth, but most of it is something else…Dark GDP being converted into something economists can kinda-sorta pretend to count.
Perhaps the best example of this is has been “housewives” leaving the home and entering the workforce. Imagine a community where 100% of the women are housewives. They perform the role of housekeeper, caretaker, chef, chauffeur, gardener, nurse, and psychiatrist…for their own families. Then…due to the changing times… all of the women in our hypothetical community decide to join the workforce and all find jobs making wages equivalent to their husbands. The economist will go crazy!!…GDP has doubled…or more. The community is obviously twice as well off right? Well…not so fast.
The truth is, in our hypothetical economy, GDP hasn’t come close to doubling. All that has really happened is that all of the work that had been done by the housewives off the books in the shadows of Dark GDP…has now come into the light to be counted by the economist. And while the working woman now has a wage, she now has to pay someone to do all of the things she used to do. So, when it is all said and done…I would grant that yes…GDP has definitely improved some because there are bona fide efficiencies to be gained in the outsourcing of the housewives duties. However, were true accounting even possible, I think it would show that around 80% of the gain was simply due to finally being able to count (and tax) the activities that were already going on. This is the true, and mostly untold story of the supposed”economic growth” we have seen over the last 50 years.
So my prediction.. only half joking is…that someday soon, the BEA will come up with a new change to GDP to somehow include in GDP not only the economic value of housewives, but also the value of the millions of people who are opting out of the labor force rather than be counted in the “unemployed” category. Currently, the rent an owner occupied home could have generated if the owner didn’t live in it is a part of GDP….so doesn’t it just  makes sense that we include the value of the services these people could be doing.. but instead have chosen not to? After all, it’s already a fairy tale number…why not give it a happy ending?
4/19/2013 Daily US Cash Deficit

By | Daily Deficit
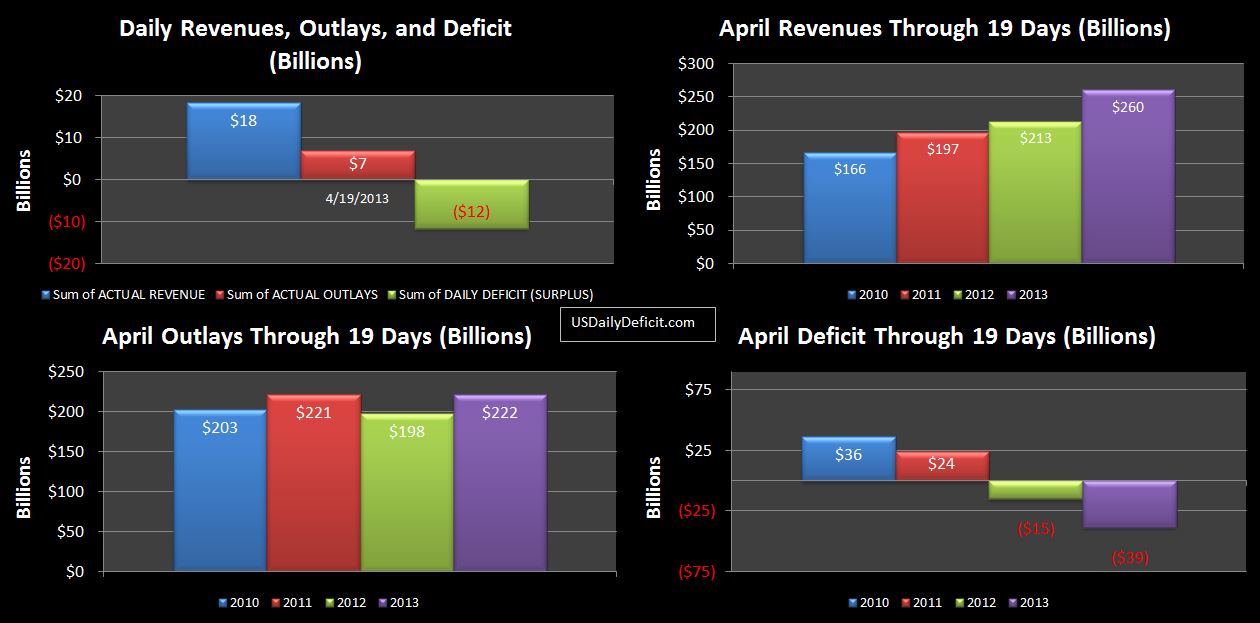
The US Daily Surplus for 4/19/2013 was $11.6T…the “Surge” continues…

2013-04-19 USDD

Witheld tax deposits are now up 9% with tax deposits not withheld up a whopping 34%. Corporate taxes are up 26%.Net revenues are up 22%through 3 weeks, with 7 business days to go. It seems like a pretty solid bet that April 2013 will top April 2012 by a healthy margin….topping $100B even looks quite possible. There is one little thing…last year on Tuesday 4/24, there was a large spike in revenues to $35B. I’m sure there is a reason because I see the pattern….a large spike in revenues ~ the Tuesday after tax day for the last 3 years. Whatever it is, I have to assume we will see it again this year….but if it doesn’t, it’s going to pull down revenues by a material amount. We’ll know by Wednesday at 4pm.

4/18 Daily US Cash Deficit

By | Daily Deficit
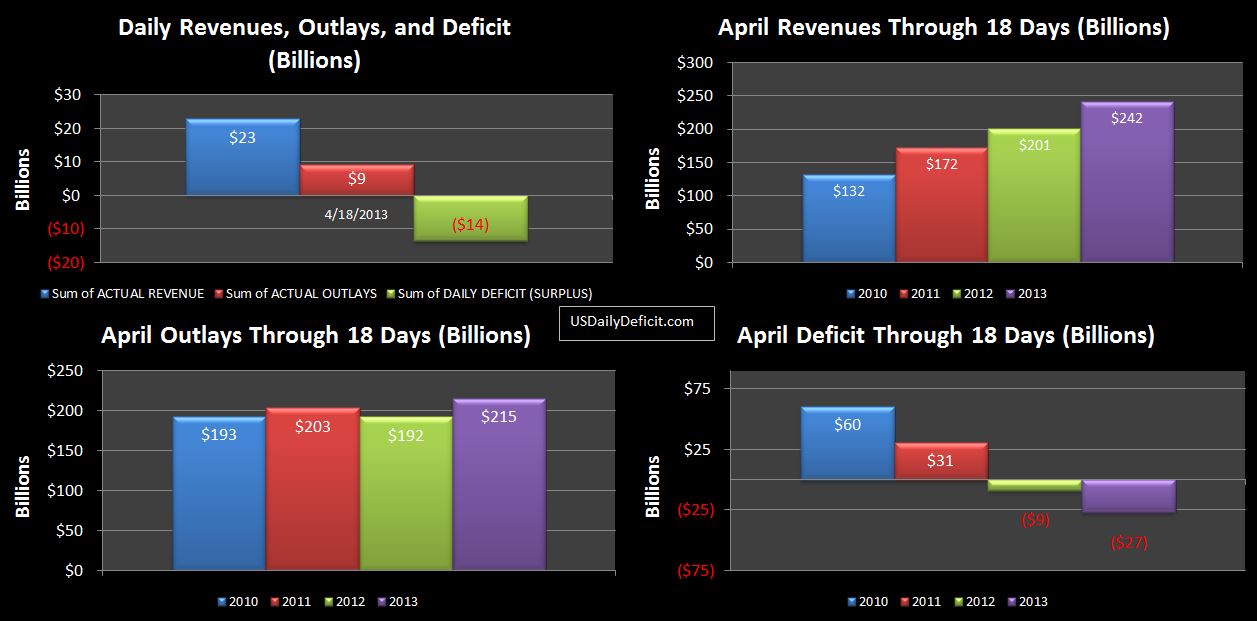
The US Daily Surplus for 4/18/2013 was $13.6B…in short, the cash continues to pour in. The fat lady hasn’t sang yet, but there is no denying that total net revenues are now up 20% over last April. Assuming everything just evened out tomorrow, we would end the month with a $80B surplus. If this pace continues, topping $100B+ certainly seems well within reach.

2013-04-18 USDD-Revenue chart

All that said, I have to admit the revenues have surprised me…I had 12% penciled in…we are sitting at 20% and gaining daily it seems. However, I just want to be clear….these suprising and positive developments we have seen over the last couple of weeks in no way shape or form mean we are saved, out of the woods, or even close to having materially fixed any of our problems. Let’s say we end up at a $120B surplus…double last year. We are still talking about a $60B improvement in a $1,000B hole. Six months into the 2013 fiscal year, which had a $1.092T deficit, we have seen an $82B improvement, with a strong push lets say we get down to $900B. That’s still a $900B annual deficit…how do you get it to zero?  While this month’s strong revenues are likely being driven by the 2013 tax hikes, moderately higher employment, and a pretty big run up in the stock market (until the last week or so)…seeing 10% + revenue growth again next year seems unlikely…without additional tax hikes, they should grow at roughly the rate of the economy.
So..to wrap this up…we are having a relatively good month…Hooray for us!! Just remember, this is a few weeks of data points in the vast economic ocean. If we are still seeing 20%+ revenue growth in 6 months (or even 3)…I’ll be happily pointing that out to the world….but in the meantime, I’m not holding my breath.

4/17/2013 Daily US Cash Deficit

By | Daily Deficit
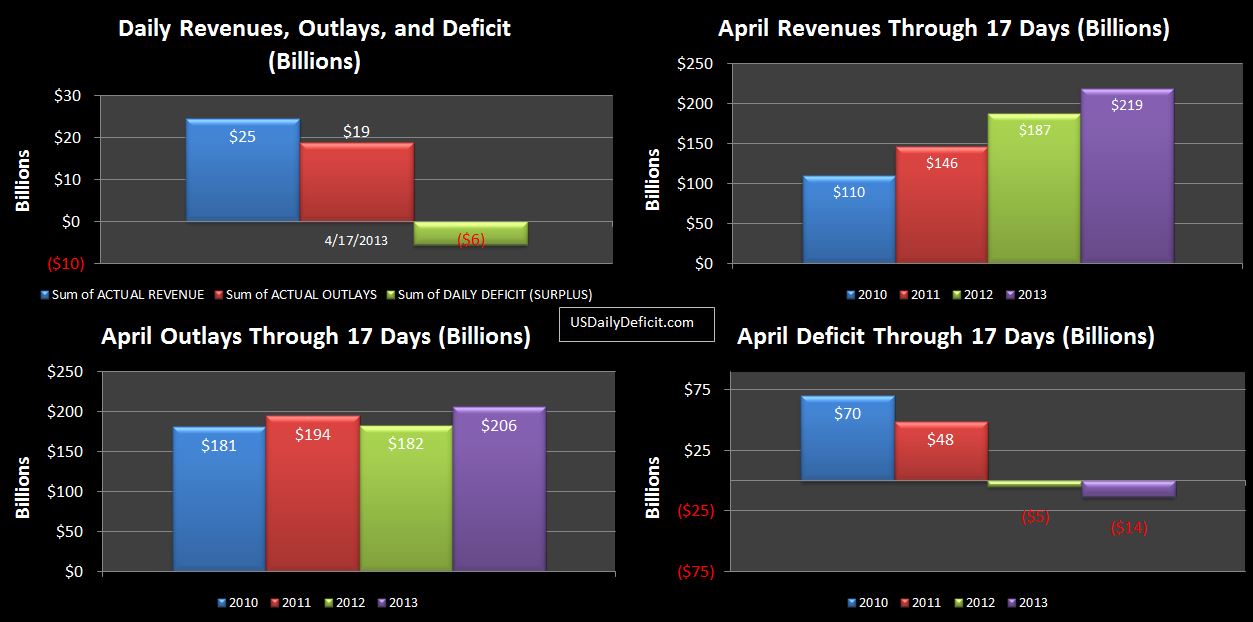
The US Daily Surplus for 4/17/2013 was $5.6B bringing the April 2013 surplus through 17 days to $14B, now $9B better than 2012. Revenues continue to outpace 2012 by a large margin, and are now showing a 17% YOY improvement for April. Outlays, adjusted for timing do appear to be down a little, which we would expect given the ongoing “sequester”.

2013-04-17 USDD

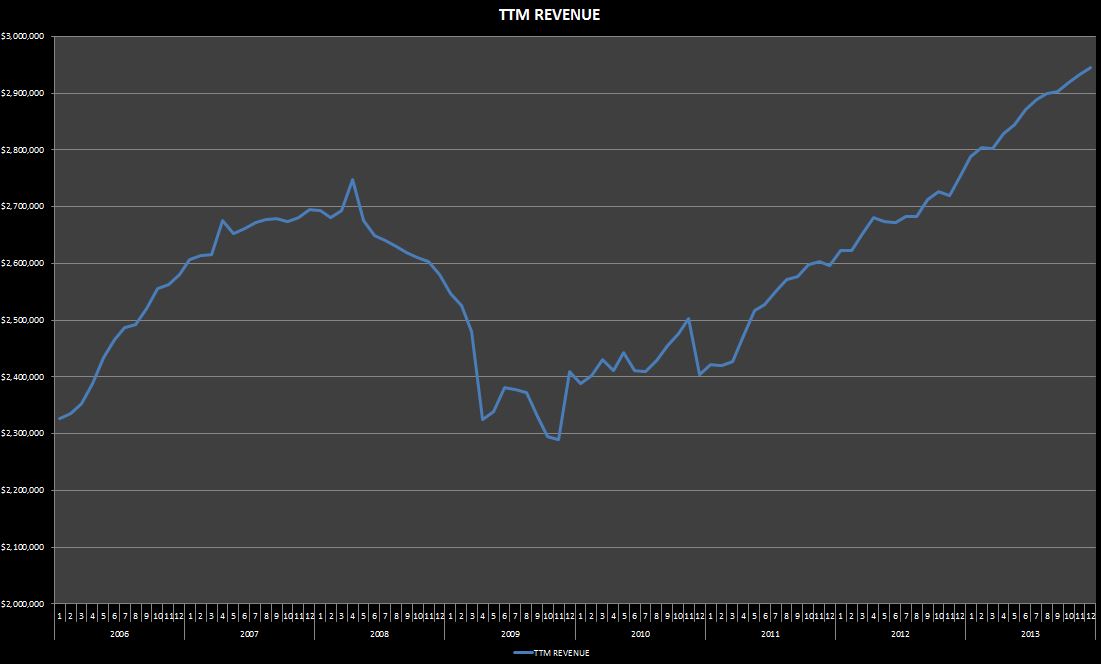
It now appears likely that 4/2013 will exceed last April’s $59B surplus and become the largest surplus recorded since 4/2008, when we posted a $188B surplus….Of course I think we all remember how that ended up…just a few months later, the deficit started to explode as revenues started falling and outlays started ballooning into the “great recession”. I’m not predicting that, but given the news cycle and the recent stock market nose dives, I don’t think it would shock anybody. I just thought it was a little eery…here’s the revenue chart for 2006-2013 trailing twelve month cash revenues.

2013-04-17 USDD-Revenue chart

You will probably need to click to enlarge, but the peak we see in 2008 is April…from there almost straight downhill. Still…you have to admit, a nice recovery starting in 2011 through today…do note that the April 2013 forward are forecasted.