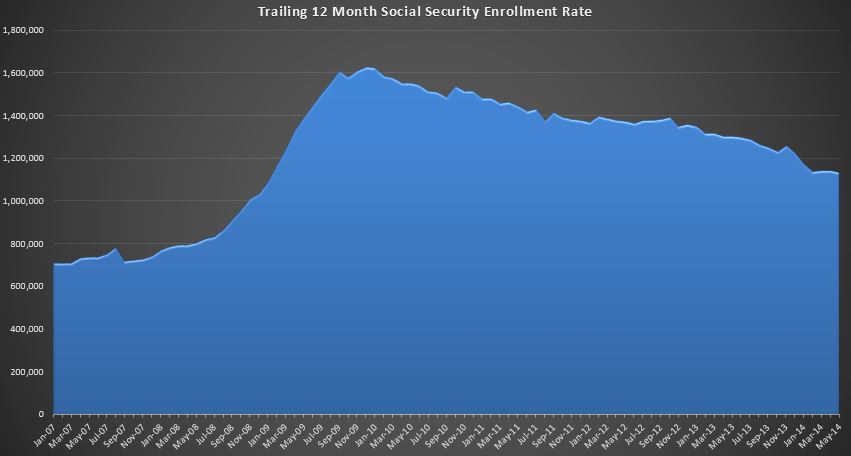
The May 2014 numbers are in and we added 114k people to the SS rolls compared to 124k in May 2013.The total consolidated enrollment now stands at 58.589M…good for 18.41% of the population receiving an average of $1187 per month.
We can see what appears to be stabilization for four months now just a bit over a 1.1M annual rate of increase. I keep an eye on this series to catch a material change in the enrollment trend….in particular the beginning of another spike like we saw in 2008-2010. Clearly…we don’t see that this month. In fact, it’s not even clear that the stabilization is a trend…yet.
As of May 2014…the rate of change in SS EFT cash outlays was +$50B annualized. This is down from a peak of $65B in Dec 2012, but it’s still a big number….requiring $50B of new revenues each year just to keep the deficit even. That hasn’t been a problem in the last year…with revenues gaining at a $300B+ rate, but this is unlikely to be the case forever.
Catch up (June/July 2018 Cash Deficit)