In Part 2, we will take a look at Outlays…if you missed part 1 on revenues, you can find it here.
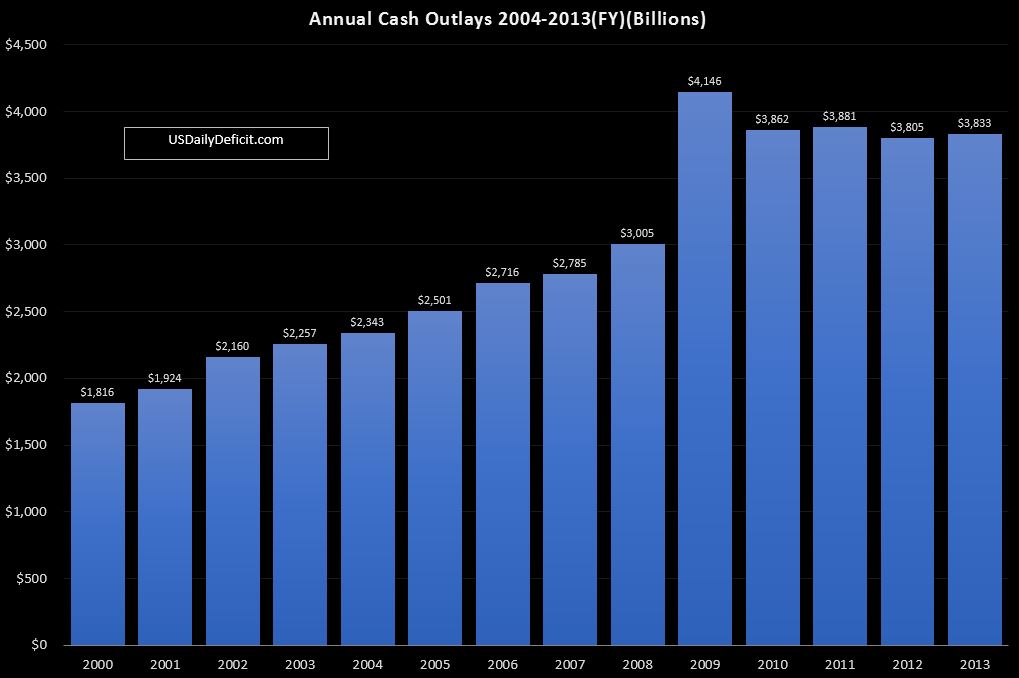
For the fiscal year, net cash outlays ended up at $3.833T, up $28B, or 0.7% from 2012’s 3.805T…so basically flat. So all of those terrible cuts the media has been reporting on all year long since the fiscal cliff and sequestration deal last year….not even enough to cut spending.
The chart above shows cash outlays by year all the way back to 2000(where my data set starts)…you can see that after a spike in 2009 related to stimulus spending, we have been more or less flat for four years now.
While the chart may not be terribly exciting, the internals show a bit more movement. What we essentially have is growth in entitlements continuing unabated, but being offset by cuts elsewhere. Most of the cuts appear to have come from defense vendors, education, unemployment, and “other”. All of that is probably a good thing, but I’m not sure how much longer it can go on. Cutting the first 10% is usually pretty easy…but by the 5th year or so….finding additional cuts gets a lot tougher. Because of this….In the next year or so, perhaps tipped by Obamacare costs, we will probably start seeing outlays resume their upward slope, putting huge pressure on the deficit…especially if revenue growth pulls back from the 10%+ we’ve seen in 2013 to 5% or so….
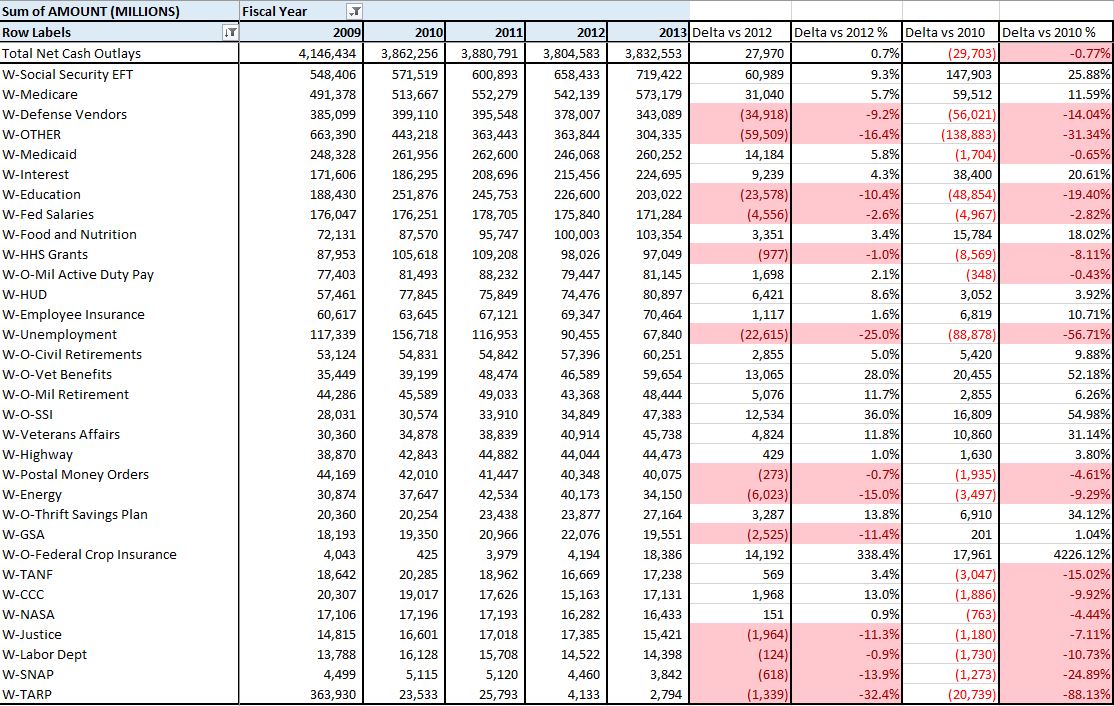
The table below gives a bit more detail on outlays by category comparing first 2013 to 2012, then 2013 to 2010…the start of this 4 year plateau.
At the top we have social security, which grew a scary 9.3%, or $61B. I suspect some of that growth is due to a push that accelerated the trend to electronic checks over paper checks as a cost saving measure. Paper checks ultimately get rolled up into “other” (their report…not mine), but only represent a small and shrinking % of the total. Going forward, we will probably see something closer to 5% as enrollment continues to grow at 1M+ per year.
Marching down the list, we see Medicare and Medicaid growing at 5.7-5.8%. Also interesting, Vet Benefits increased 28%, Military retirement outlays increased 11.7% and Veterans Affairs grew at 11.8%. These are all relatively small, but seeing growth rates that high in nondiscretionary categories is not a good sign for the long run.
To wrap it up….it was good news that once again outlays were more or less flat for the fourth year in a row, thanks in part to the sequestration that many, including myself, thought was unlikely to actually stand. So in that…a small victory. But the question remains…what’s next? Given the uncertainty surrounding the shutdown and the debt limit, it’s kind of hard to predict, but if we can assume that these are resolved and more or less maintain the status quo, I guess we end up next FY closer to $3.9T….perhaps higher if Obamacare costs push through to the bottom line.
In the long run….all that is going to matter is the growth of entitlements. If we can’t cut the growth of SS, Medicare, Medicaid, food stamps ect….we’re toast. Unfortunately, everyone is too scared to talk about that lest they piss off the huge senior voting block. And that’s why it won’t ever happen. Apparently, in a democracy, collapse is the only way to stop the old/rich/powerful from screwing over the young/poor/weak.


Catch up (June/July 2018 Cash Deficit)