Just a refresher to start off…the Social Security Program covers nearly 58M people with an average monthly benefit of $1184 per month based on my calculations. Of the 58M, 38M are retired workers, 9M are disabled workers, and the rest are generally spouses and children eligible for some form of derivative benefit.
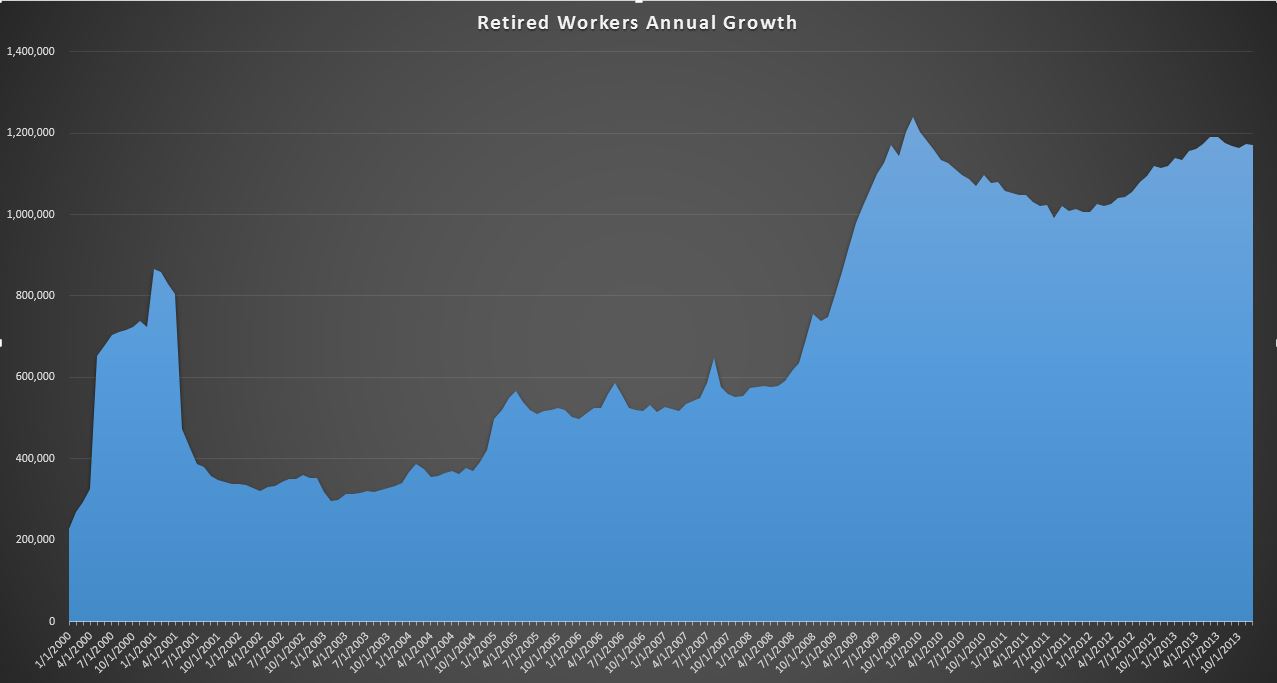
The recently released December numbers show additions of 62k people, 57k of which was the retired worker program, with most of the other categories more or less netting to zero. Compare this to last December, when 59k were added to the retired 99k were added in total. So retired workers are more or less flat, but still running at a 1.172M pace not far off the 1.240M record set back in 12/2009.
In the remaining categories, the biggest story is that the disabled worker category, for all of the headlines about record levels, only added 924 people for the month, though obviously setting a new record. The annual growth rate is now down to +115k, down to about a quarter of the record 416k pace set back in 11/2010. Now granted, it’s definitely not a good thing that we have nearly 9M disabled workers, but at least for the time being, the growth rate has dropped from 5% to 1%….a small victory, but we’ll take it. More or less, it seems that aside from retired workers, the rest of the SS population has stabilized…for now.
Retired Workers TTM Growth:
You will probably want to click on this chart to make it bigger, but it shows the annual rate of change in retired workers starting in 2000 when the rate was 227k all the way through December 2013. The primary reason I track this data series is because we all hear that there is a huge wave of boomers that will be retiring over the next 10 years or so. We are already adding enrollees at a very high rate…I want to see when/if the rate starts growing and I think this chart will be the alarm. Since this is the largest piece of spending in the federal budget, understanding growth in this program is critical to forecasting future outlays. For now, we remain on a high plateau adding nearly 1.2M people per year with no noticeable change in December.
Looking ahead, it turns out that a lot of people historically retire in January…last January the rolls added 171k people… nearly 3X as in December. It will be interesting to see if this trend continues, or if our “booming” economy and stock market convinces some of those people to put off retirement.

Catch up (June/July 2018 Cash Deficit)