Category

Fiscal Cliff

Last Year’s Debt Ceiling Fight

By | Debt Limit, Fiscal Cliff

I was watching “Meet The Press” yesterday and during David Gregory’s interview of Mitch McConnell, Gregory was hounding McConnell on whether or not he would use the debt limit as a bargaining tool over the next month. Fair enough, but one thing he kept repeating kept grating against my skull. He kept implying that the reason the US rating was downgraded after the last round was simply because the fight happened in the first place. This is ridiculous. The debt was downgraded because we as a nation have a negative cash flow of about $100B per month and no viable plan to even marginally address this problem. Gregory kept implying that if only Republicans had not made the debt limit an issue, our credit rating wouldn’t have been downgraded. Financial ignorance is nothing new, and since McConnel didn’t call him on it, it’s a pretty safe assumption they are in the same boat. Looking at the facts, it’s a wonder US debt isn’t rated as Junk.

Full Disclosure….a few years back I liquidated about $1k of savings bonds my kids had received from their grandparents for college and purchased silver dollars. I have no regrets.

Fiscal Cliff Thoughts 12/31/2012

By | Debt Limit, Fiscal Cliff

With about 6 hours to go, I am reading a report saying a deal is close on avoiding the fiscal cliff, with just a few sticking points to be ironed out. I don’t know the details yet, but I doubt that it matters too much. I don’t think anyone ever expected rates to increase on most of us, regardless of whether the deal was done a few weeks back or even six months from now. Here’s what you need to know…while Republicans and Democrats have been engaged in an epic battle over whether to raise taxes on the “wealthy” by $25B per year or $50B per year….your taxes were raised $125B for 2013 due to the expiration of the payroll tax cut.

Now honestly, this probably needed to be done…especially if you are in the camp that believes the social security trust fund isn’t make believe. But the truth is, FICA is an income tax no different than any other, and while they distracted the country over the last month arguing over whether “wealthy” was defined as $250k per year or $1M per year….both parties quietly raised everybody elses taxes 2%. I’m waiting for the outrage that won’t come because let’s be honest…as a nation, math really isn’t our thing.


We Won’t Miss TARP, But Uncle Sam Will

By | Debt Limit, Fiscal Cliff

TARP, the unloved program that either saved the economy or bailed out the bankers depending on who you talk too will probably be wound down over the next year. According to the latest report, the remaining balance outstanding is a little less than $50B. You may want to hold off the Champaign though, because when TARP is gone, so are the cash inflows it generates. Over FY 2010-2012, TARP contributed almost $300B in cash inflows to the federal coffers, reducing the cash deficit and the need for borrowing over that time period. To understand how, let’s first imagine TARP as a two year program. In year one, $700B of cash goes out, resulting in a $700B reported deficit. However, while there were certainly losses, TARP wasn’t a complete loss, as a majority of the money was eventually paid back. Back to our example, let’s say in Year 2, $600B was paid back and $100B was written off. Thus in year two, we record a $600B surplus. Clearly this is different than how a public company would account for the transactions…welcome to government accounting. Now obviously TARP was not a two year program, but the implications are similar. Reported deficits primarily incurred in 2009 are now being offset in future years as balances are repaid or sold.

Now at this point you may be thinking, what’s the big deal? So $50-$100B of “revenue” is about to dry up, that’s only around 2% of federal revenues. I bring it up because I just read an article comparing Obama’s tax plan to Boehner’s. According to the Tax Policy center, Obama’s plan would raise taxes on the “rich” by $40-$45B next year, while Boehner’s plan would generate about $20B. So neither comes close to even plugging the hole TARP, an admittedly small revenue source will leave when it is gone next year. The spending side offers little relief either. Next year alone, we can probably expect Medicare and Social Security spending to increase around $100B together, which is around the magnitude of spending cuts being discussed. Using the Daily Treasury Statements as a source, we can see that the trailing twelve month cash deficit as of 11/30/2012 was $1.176T, that’s over one year, not ten. The bottom line is, there is nothing serious about any of the proposals on the table. It is becoming increasingly clear that we as a nation will not voluntarily address this problem. That said, before you bid on that next round of 30 year notes, you might want to ask yourself what the world is going to look like in 30 years when you try to cash it in.

The Big Picture

By | Daily Deficit, Debt Limit, Fiscal Cliff
     This is a repost from November…I’m bringing it back to the top for the new visitors we are seeing from Seeking Alpha
The chart below shows us what I believe is the most comprehensive metric for tracking our debt and deficit woes…the Trailing Twelve Month Deficit (TTMD). The TTMD is important because costs and revenues can swing wildly from month to month, but do exhibit annual patterns, so comparing a month to the same month a year ago is a much better indicator of whether the deficit is growing or shrinking than comparing it to the prior month. February is a great example. Most folks get all the tax forms they need to complete their taxes by the end of January, submit them, and get their tax refunds in February. This makes February the worst month of the year, with a $249B deficit in 2012. April, on the other hand, just 2 months later is generally the best month of the year, as those who owe taxes wait until the 4/15 deadline to pay. In 2012, April posted a surplus of $58B. If you were trying to project a trend over the Feb-April period…you simply would not have much success.  The TTM solves this and in  my opinion gives us a superior metric.

     Looking at our chart, we can see that we end 1999 with a $190B TTM Surplus, which grows and peaks at $307B in Jan. 2001. At that point we see the trend reverse, going negative in 2/2002 and leveling off around a $300B annual deficit. By 2006, we start to see some improvement, getting within $64B of a surplus in 4/2007. Then, things start deteriorating again, ultimately falling off a cliff in 2008 and bottoming out in 9/2009 at a staggering $1.8T rate. From there, as TARP and other bailout related spending slowed down, we have seen gradual year over year improvement and are currently sitting on a $1.1T TTM rate. The rate of improvement seems to have slowed down, though it will take a few more months to see if this is truly a trend.
     And that is where we are right now….running approximately a $1.1T annual deficit. Going forward, assuming the status quo, we can probably expect costs to continue creeping up, driven by entitlements and interest payments. We can also probably expect revenue to continue to increase at a roughly similar rate, leaving us with a structural deficit of somewhere around $0.9-1.1T. On the table with the fiscal cliff is roughly $100B in spending cuts and $400B in tax increases…though I don’t think anyone expects much of this to actually stand…but even if it did, it wouldn’t come close to closing the gap. In short, the situation looks pretty hopeless, which is why I am nearly certain, one way or another, the US will default on much, if not all of it’s debt and other obligations/promises some time in the future. When?? It is impossible to predict. Probably not in the next 6 months….though with the debt ceiling just a month or so off, it is possible…. On the other hand, at this rate, in 18 years (2030), we are at $36T…a fairly preposterous number. So anywhere between now and then is my guess. 🙂

The Spending Problem

By | Debt Limit, Fiscal Cliff
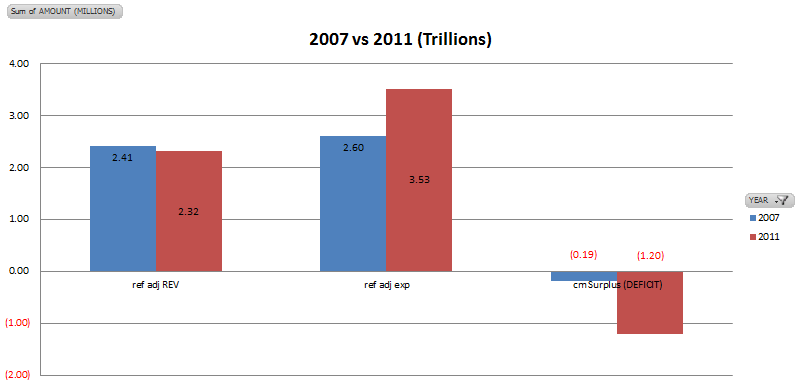
In April 2007, something amazing almost happened…driven by strong April tax collections, we came within a mere 64B of posting a Trailing Twelve Month (TTM) surplus, a feat not achieved since 1/2002. From there, the deficit proceeded to explode…topping out at $1.8T in 9/2009 before gradually improving to the “healthy” $1.2T we saw with the close of 11/2012. So let’s compare 2007 to the latest full year we have, 2011, and try to figure out what happened. 2007 ended up with a $190B deficit…2011 ended at $1,204B….a $1T change in a mere 4 years. If you listened to the news lately…you would probably guess that plummeting revenues and soaring costs together created the mess we find ourselves in. You would be partly wrong.

The truth is, Revenue was pretty constant over that 4 year period, dropping $87B from 2007 to 2011. Spending…on the other hand spiked $925B. So of the $1T increase in deficit from 2007 to 2011….about 10% of that was from lower revenues….and 90% was from higher spending.  So…that’s kind of understandable in 2008-2009…when Tarp money was flowing out…but 2011? What are we spending another $1T per year on that we weren’t in 2007? I sure don’t feel like I’m getting another $1T worth of government services…do you?

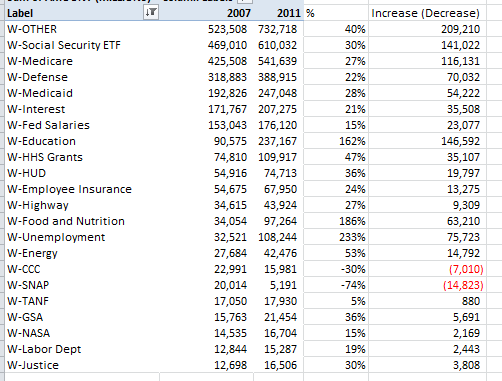
The above table has a handful of the spending categories reported in the DTS…we just line up 2007 with 2011. With the exception of a few small categories, spending is up…huge. Over a period when revenue was essential flat, and population growth up perhaps 5%….spending is up accross the board 36%. Most is already locked into a steady upward trend like Social Security and Medicare. What’s left is too small to make a difference. For anyone looking…the future is quite obvious. Spending will continue it’s upward trajectory and whatever revenue additions our government manages to squeeze out of taxpayers will be both inconsequential and fleeting. As a result…deficits will continue to soar and the debt outstanding will continue to climb until external parties refuse to buy any more debt and start liquidating what they do have. At that point, either the spending stops…and trillions of off balance sheet liabilities like social security and medicare are defaulted on, as well as on balance sheet liabilities like bonds outstanding and government/military employee pensions.
The other option is that they just start printing money…which lets be honest has already started. The treasury has accelerated a little game they like to play with the federal reserve. The federal reserve magically creates “e-money” and uses it to buy debt from Treasury. Then, when the interest payments are due…treasury hands them off to the Fed…who turns right back around and gives it back….and reports it as REVENUE!! Per my back of the envelope calculations…this accounts for about $1.7T of our current outstanding debt. In this scenario…the price of everything increases as the value of the currency declines. It’s a kind of an invisible tax…rather than directly taxing you, the government steals it while you aren’t looking. That CD that used to yield 5% and is now 0.25%. That $20 that used to fill your tank…now gets you half. That $1.5 pound of ground beef that used to feed your family…now $3.50. We kid ourselves playing games with accounting, debt, and these silly keynsian theories, but in the end, the “Econoverse” always wins.