Category

Daily Deficit

5/10/2013 Daily US Cash Deficit

By | Daily Deficit

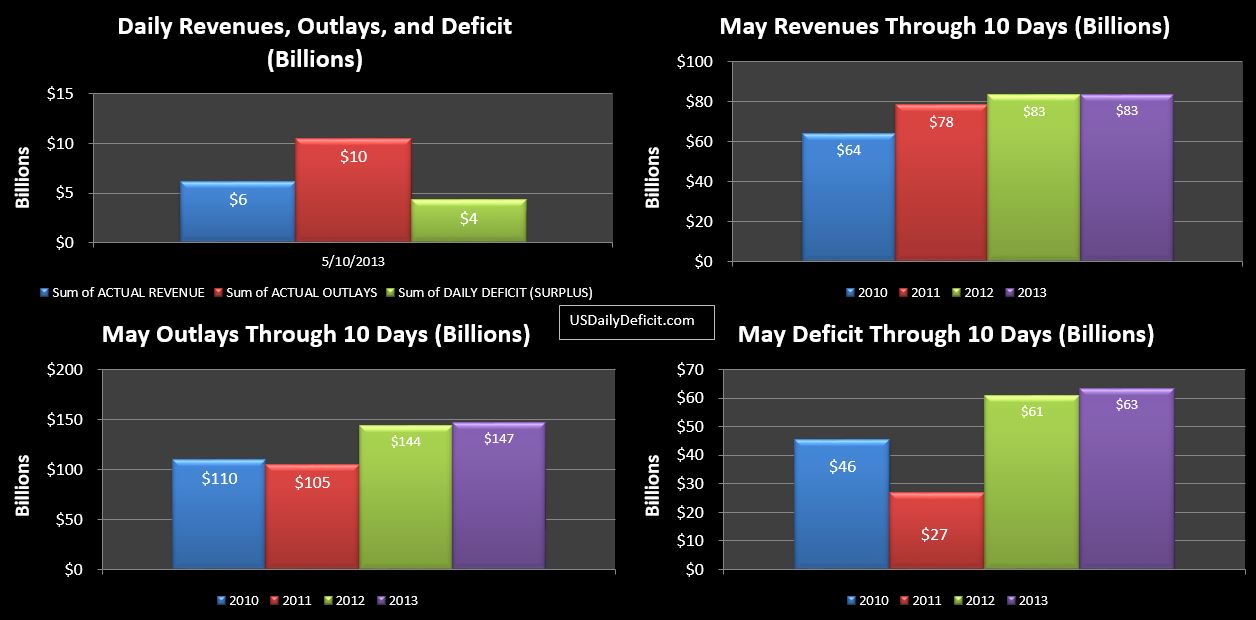
The US Cash Deficit for Friday 5/10/2013 was $4.3B bringing the May deficit through 10 days to $63B. May 2013 vs 2012 still look more or less the same on all fronts, though some of this is timing related. We’ll get another more or less synchronized snapshot this Wednesday, then on Thursday we get to see a ~30B interest payment and some corporate taxes…small, but worth taking a look at.

2013-05-10 USDD


5/09/2013 Daily US Cash Deficit

By | Daily Deficit

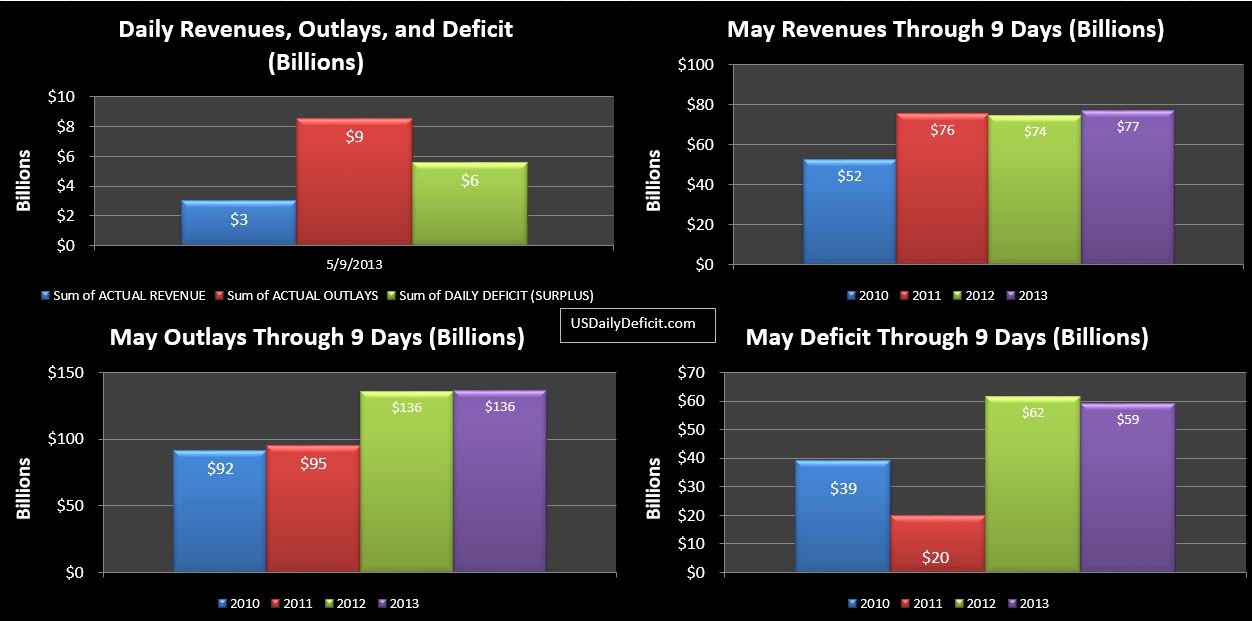
The US Daily Cash Deficit for 5/9/2013 was $5.6B bringing the May 2013 deficit through 9 days to $59B.
2013-05-09 USDD

May 2012 and May 2013 are essentially the same YOY… a $6B increase in taxes withheld is being offset by decreases in taxes not withheld, unemployment deposits from the states, and federal reserve “earnings”.

A few weeks ago, I mentioned here that it looked like Treasury was stockpiling cash in preparation for the upcoming debt limit showdown…they had issued debt despite the huge April surplus, accumulating nearly $214B in cash as of 4/30….a two year high. Since then…cash has dwindled back down to $97B due to the cash deficit over that time, and a net paydown of external debt of $56B..including $31B yesterday. So…whatever the reason…it no longer appears like they are going to try and hit 5/19…the day the current infinite limit expires with a huge cash balance in the $200-$300B range…though if they are going to, they still have a week to make it happen.

Finally…just for fun since I completely missed last month…I’m going to guess the May deficit comes in at $140B…just topping last year’s May deficit of $136B. Revenue will be up 10% or so, but with 6/1 on a weekend, we’ll see $20B or so of extra cost hit 5/31 pushing the deficit up for May, but being offset in June, which very well could post a surplus.
5/08/2013 Daily US Cash Deficit

By | Daily Deficit

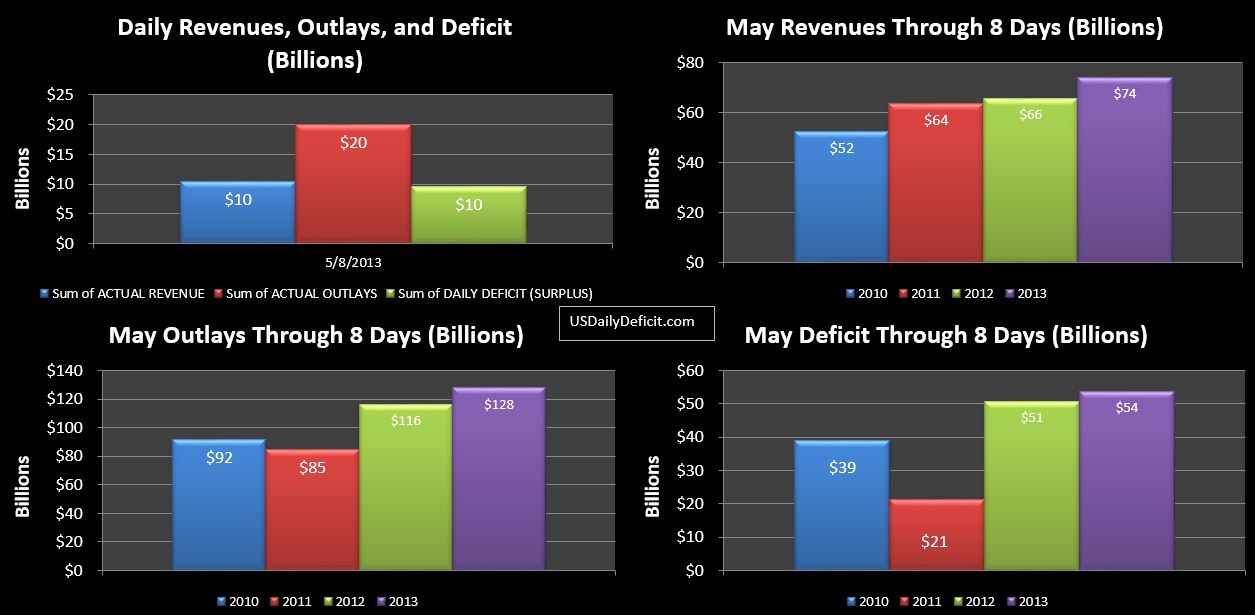
The US Daily Cash Deficit for 5/8/2013 was $9.6B bringing the deficit through 8 days to $54B…edging ahead of last year…primarily related to timing….2012 is a day behind….lacking both strong Wednesday revenues and the Wednesday Social Security payment now included in the May 2013 population.

2013-05-08 USDD


5/07/2013 Daily US Cash Deficit

By | Daily Deficit

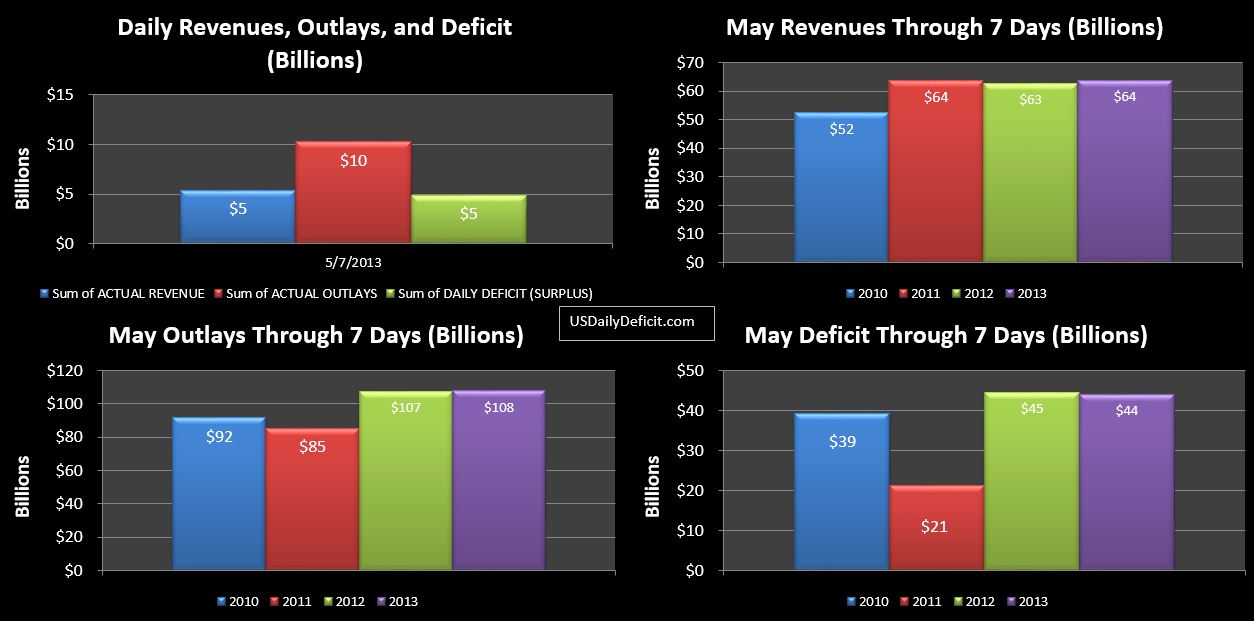
The US Daily Cash Deficit for 5/7/2013 was $4.8B bringing the May 2013 deficit through one full week to $44B.

2013-05-07 USDD

As expected, given a full week, 2013 has more or less synchronized with 2012….and the two years look a lot alike. Looking just at total revenues, we are basically flat, with net revenues up a little over 1B…or 2%. Digging into the details, there are a lot of moving pieces. Taxes withheld are up $5B, or 12%…this is the main metric we are looking for, and it is slightly ahead of where we would expect it to be if 10% was our baseline. However, this is being offset by a $3B decrease in taxes not withheld…as discussed earlier they literally fell off a cliff after 4/30.

I’ve been saying for a while now that May and June of 2013 were going to be our first clean glance at tax revenues following the new tax hikes. The same could probably be said about outlays…we can more or less assume that a month into it, the sequester should be fully in effect by now…so whatever savings there are going to be should show up in cash. So 25% of the way through May, we can see tax deposits holding up and sticking to the same trendline…10-12% growth that we have seen for the last couple of months. This is more or less what we want to see…obviously the bigger the better. Through only 1 week, the gains in taxes withheld are being offset elsewhere, but these will likely become immaterial as the month goes on. Looking at outlays…pretty much spot on with last year…certainly no massive drop-offs, but nobody was really expecting that anyway.

Looking ahead to tomorrow…Social security payments went out today, so a deficit in the $10B range can probably be expected.

5/06/2013 Daily US Cash Deficit

By | Daily Deficit

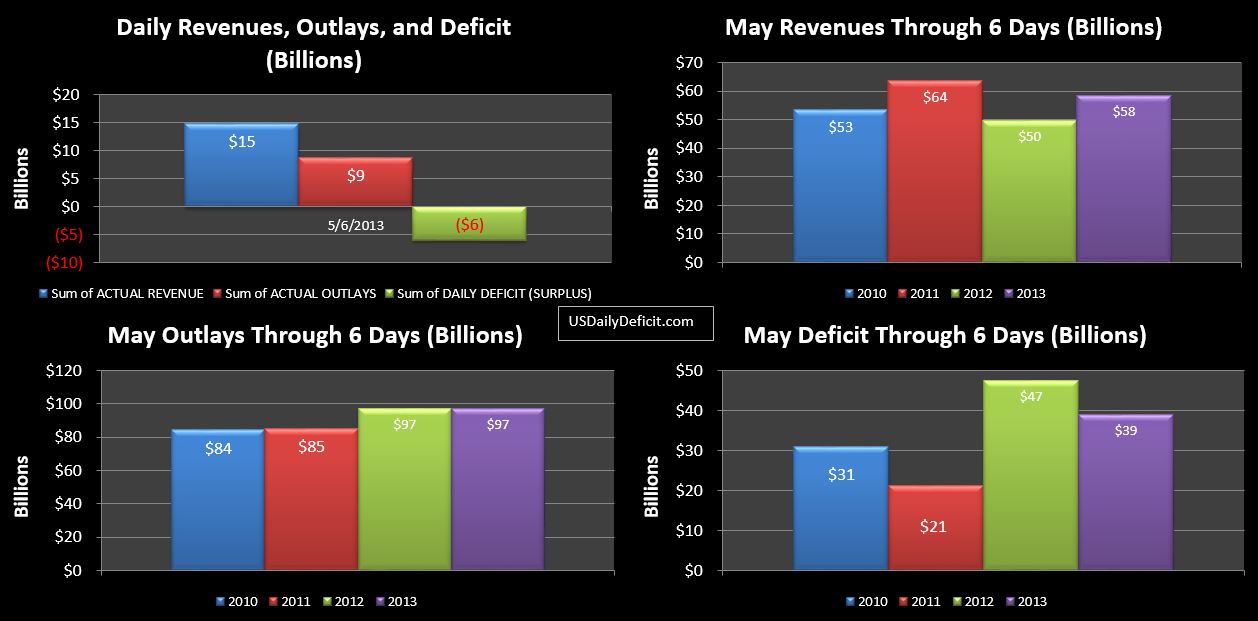
The US Daily Cash Surplus for 5/6/2013 was $6.1B riding traditionally strong Monday revenues, including a strong wave of “Unemployment” inflows from the states. I’m not sure why, but May is always the heaviest month for this particular revenue stream….of the $60B or so the government gets over a 12 month period, about $20B of it is in May. To date, we have seen $13B this May…pretty much in line with last year.

2013-05-06 USDD

Looking at our charts, we see that through 6 days revenue is up $8B…a fairly large number for less than a week, but I suspect some of it is just timing…Through 6 days, May 2012 had not yet had a Monday…with the associated strong revenues. So tomorrow, the months will more or less sync up….giving us our first glance…though admittedly very preliminary glance at revenues. Outlays are more or less in line for now…expect that to start jumping around with the upcoming social security payments. So far…nothing out of the ordinary to suggest a deviation from 10% revenue growth and flat outlays…