The US Daily Cash deficit for 6/1/2013 was $14B as strong revenues (due to it being a Monday and beginning of the month) of $27B were offset by $41B of outlays…including $24B for the first round of Social Security payments. No charts today…doesn’t really make sense this early. I’ll just say that revenue does appear to be off to a strong start, but we really need at least a full 5 day week to really start comparing.
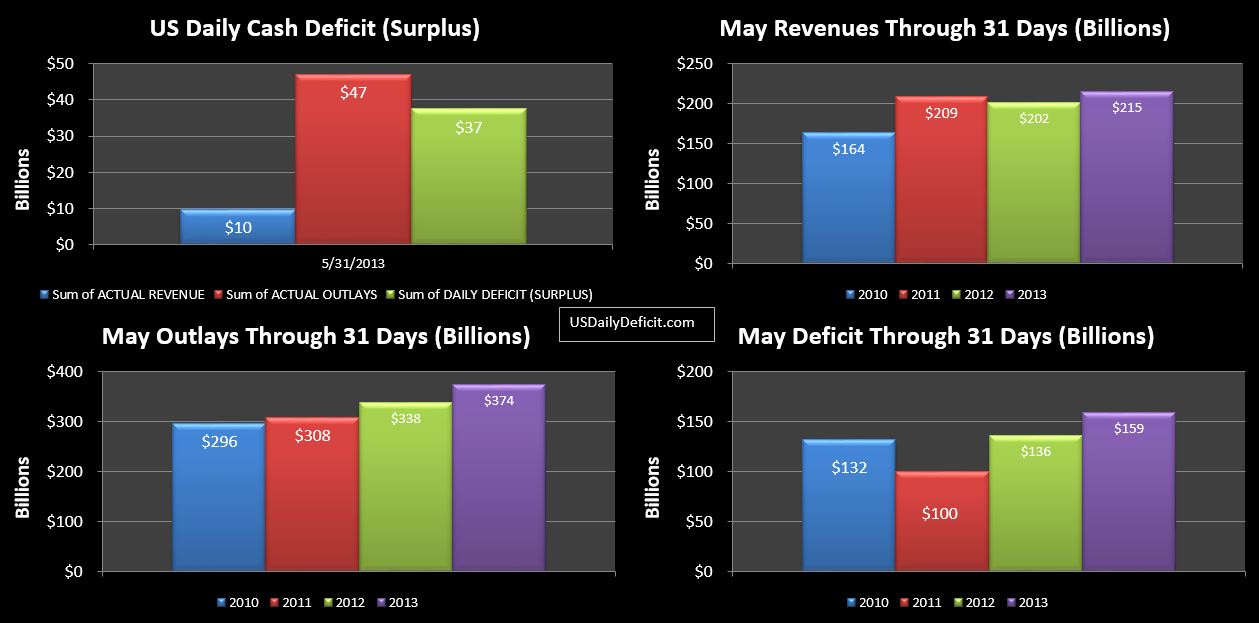
The US Daily Cash Deficit for 5/31/2013 was $37.5B, wrapping up May 2013 with a $159B deficit compared to May 2012’s $136B. However, as suspected, about $30B of June outlays were pulled into May due to 6/1 being on a weekend. Adjusting for this, May would have posted marginal, but not that impressive improvement.
Cash:
As presumed, Treasury Secretary Lew started pulling money out of his magic hat…about $31B of “extraordinary measures”, raising enough to pay the $47B of 5/31 Outlays and increase cash from $20B to $35B….which should be enough to clear the 6/3 Social Security Payments of $25B.
Revenues:
While tax deposits withheld were up nearly 13% YOY, Declines elsewhere reduced the total revenue YOY growth to 6.6%, a disappointing follow up to April’s 26.6% surge. So revenue is a mixed bag. It is a very good sign to see taxes withheld…by far the largest source of revenues continue to see solid YOY growth above 10%. On the other hand….those other sources of cash are important too, and 6.6% growth is disappointing, but it is just one month. If we are ever to fix the deficit problem, and I’m on record as doubtful….we are going to string together 5-10 years of double digit revenue growth with 5-10 years of single digit outlay growth.
I’ve been saying for a while now that May was going to be our first clean look at the 2013 tax hikes. 6.6% is well below what I expected, but as noted, the internals do show some promise. June, as a quarter end will give us our second clean look at the 2013 tax hikes….though there seems to be a good chance a $60B payment from Fannie Mae will provide the illusion of another surge. Good thing I know how to subtract:)
Outlays:
While they post as up 11%, most of this is the June cost pull foreword of about $30B. This will fall out in June as a decrease in cost. Adjusted for this, we see another month of flat cost..no real surprises. Of interest, Social Security was up from $56B last May to $61B this year, a 10% gain, and over $60B annualized. On the other side, we saw spending on defense vendors and unemployment each fall $2B. Unfortunately, sooner or later, the falling categories are going to flatline while SS is going to start accelerating the other way.
Summary:
On the surface…it was an ugly month. Deficit up, cost up, and revenue up only 6.6% vs. the 12% or so we were expecting. But when you look inside, the cost was nearly all timing, and while revenue really was down, the withheld tax deposits number was actually the best through 5 months. So onward we go to June, which should be another interesting month. We will get a chance to see if the internals of the revenue were one offs, or if a trend one way or the other is being established. I will be keeping an eye on the taxes not withheld number for this quarter close, and we will also get to see more “extraordinary measures” shenanigans, topped off by a $60B payment from Fannie Mae predicated in some rather outrageous accounting gains. This one could get crazy, but right now,I would forecast about a $15B normalized Surplus for June, but then add $30B for the cost pushed to May, and another $60B for the prospective Fannie Mae payment…so $105B surplus with revenues and Fannie Mae being the wildcards.
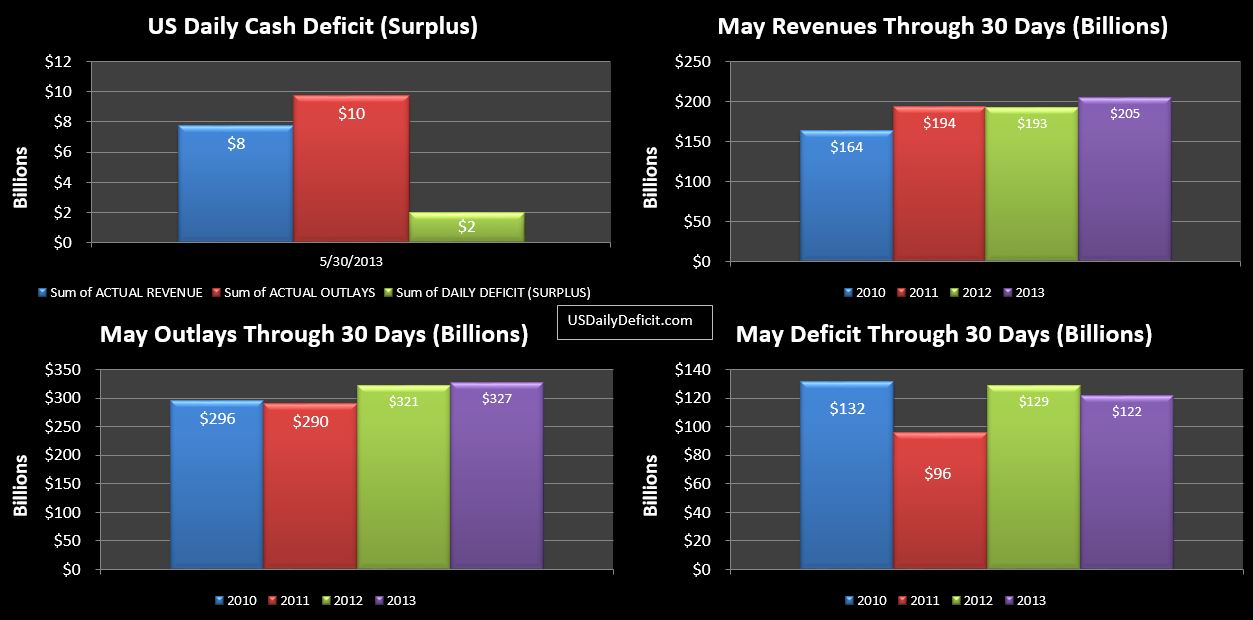
The Us Daily Cash deficit for 5/30/2013 was $2.0B bringing the monthly deficit to $122B with one day to go. through 30 days last year was at $129B, so a $7B improvement all else equal. The 5/31 numbers (we will get them Monday) have a lot of uncertainty. A final interest payment goes out that should be $5-6B, as well as normal operations…all else equal, we would probably run about an $8B deficit and end up at $130B. However, there are a lot of payments due 6/1 that probably went out today…my guess is anywhere from $15B to as much as $30B + if a large Medicare payment gets pulled forward as well.
Cash improved by about $5B today, despite the deficit thanks to the first definitive evidence to date of “extraordinary measures.” It’s a classic pattern…basically they pulled about $7B of intergovernmental off the books…pretending it no longer exists for the time being, yet promising to “pay” it back once the debt limit is raised. With intragovernmental down $7B….they find themselves $7B under the debt limit…so of course they issue $7B of “real” debt in exchange for real cash. I don’t fully understand the technical rules… there are limits… but it is all quite silly if you think about it. What with the pretending to temporarily write off the money we are pretending we owe to ourselves and such….par for the course I suppose.
So…expect large deficits 5/31 and 6/3…and a lot more “extraordinary measures”
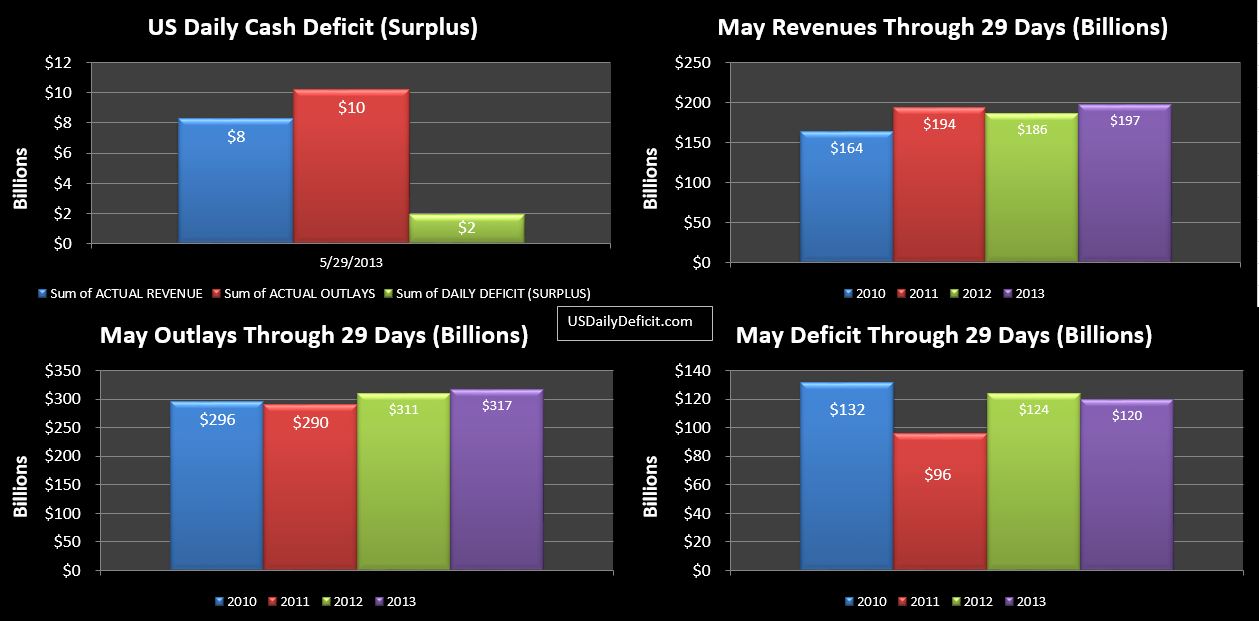
The US Daily Cash deficit for 5/29/2013 was $1.9B bringing the May 2013 Deficit through 29 days to $120B, just $4B under May 2012 through 29 days. Revenue is up 6% and outlays are up 2% with 2 business days remaining.
With the deficit, cash is back down to $14B from $16B yesterday with somewhere between $30B and $50B of outlays due to go out Friday.
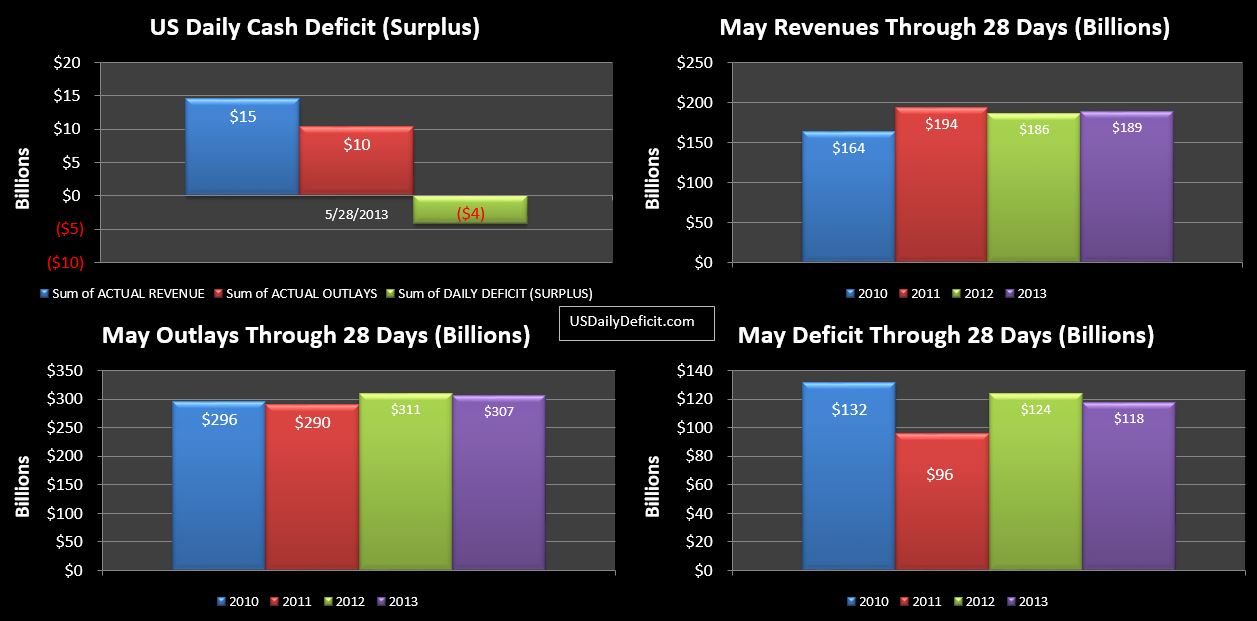
The US Daily Cash Surplus for 5/28/2013 was $4.2B bringing the May 2013 deficit to $118B with three business days remaining.
Cash:
Thanks to the surplus, cash edged up from $12B to $16B…still no signs of extraordinary measures, but as discussed yesterday, we should see it on Friday.


