Category

Daily Deficit

2013 Social Security Tax Hikes-Fun With Math

By | Daily Deficit

I’ve been wanting to dig into the details on this for a while…so here goes.

The most noticeable tax hike for most of is was the 2% increase in the social security tax from 4.2% to 6.2%…which all 134M of us with day jobs noticed around January 15th. Now…2% sounds like a pittance, but the base is so broad, it’s actually not.

So…some background. FICA taxes are really just an income tax…supposedly earmarked to pay for Social Security and Medicare. Cash, however, is fungible, and at the end of the day, all the cash goes into the same pot, and shortfalls are settled with IOU’s rumored to be kept on post it notes. All income up to ~$110k is subject to a 15.3% tax….half paid by the employee, and half paid by the employer…but don’t kid yourself here…you pay all of it. 6.2% is earmarked for Social Security, and the other 1.45% is for Medicare (I think)

So…an employee earning $50k per year would have $3825 deducted each year from his paycheck…and his employer would kick in another $3825….and send it all to good ol Uncle Sam…$7650 per year (That’s not exactly chump change!!) A few years ago, as part of the stimulus…they decided to lower the employee portion by 2%….This ended in 2012…thus we all ended up with a 2% tax hike…$1000 per year for our employee making $50k per year. Looking at the math…the rate went from 13.3% to 15.3%…a 15% increase.

From there…I found this document from the SSA..the total 2012 tax receipts related to FICA was $796B…good for 37% of taxes withheld in 2012…so a pretty good chunk. So…one would expect with a 15% tax increase, FICA taxes would increase from $796B to $915B, all else equal, so about $120B for the year, $10B per month. Very important to note..this is a one time bump from 2012 to 2013. Assuming we end 2013 with around 12% revenue growth, a full 5% of that will have come from this tax hike, and thus we won’t see another spike in 2014…we’ll just continue along at a higher base.

So…let’s think about 2014. Current employment is about 135M people and we seem to be adding jobs at about 2M per year. So in 2014, there will be 2M more people working…if their average wage is $50k, that alone would add $15B per year to the coffers…a 1.6% increase. That’s 1/4 of our recent payday loan from Fannie Mae. In relation to the $3.8T federal budget…it’s a rounding error.

I guess the point of all of this is to point out that yes…2013 tax revenues are showing very healthy increases. These increases are large, and they are material to the deficit. In fact…if we could string another 3 or 4 years of this together like the CBO thinks we will…the deficit situation would be vastly improved by 2016. However….given the math behind the increases, the data does not support this optimistic view….instead, the admittedly impressive 2013 revenues seem very likely to be a one time event caused by tax hikes and tax avoidance transactions that pulled income into 2012(with taxes paid in early 2013). If this is all true…then 2014 revenue could see low single digit growth, or even shrink…having huge implications for the 10 year picture.

And that’s why I haven’t got that excited yet about the surge in 2013 revenues. If…at the end of 2015, revenues are close to posting their third consecutive year of double digit growth…this pessimist will absolutely be forced to start re-examining my fundamental assumptions. Our $17T of debt took decades to accumulate and it’s going to take more than one year of double digit growth to even stop digging this hole, much less actually start paying it down.
7/01/2013 Daily US Cash Deficit

By | Daily Deficit

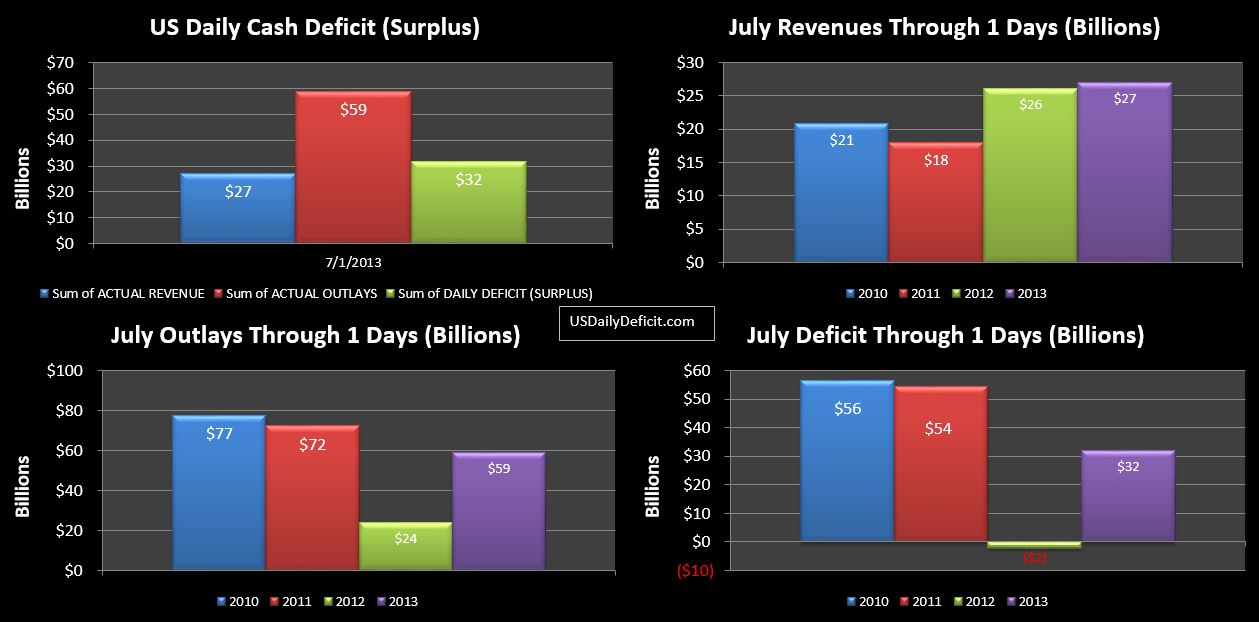
The US Daily Cash Deficit for 7/1/2013 was $31.9B…burning through half of June’s payday loan from Fannie Mae in a single day!! Why doesn’t treasury tweet that?

07-01-2013 USDD

It’s way too early to look for trends, but we see revenue up 4%. Cost appear to be up huge…but if you recall from the June discussion, in 2012, July had about $35B shifted into June….take that out and we’re pretty even.

Looking back, July 2012 posted an $82B deficit…despite the cost shift. I’m going to guess we end up in the same ballpark…say $80B. That assumes that we’ll see about 10% revenue growth and modest decreases in outlays….more or less making up the $35B hole we are starting in. So let’s sit back and let the facts start rolling in!!

June 2013 Deficit Update

By | Daily Deficit

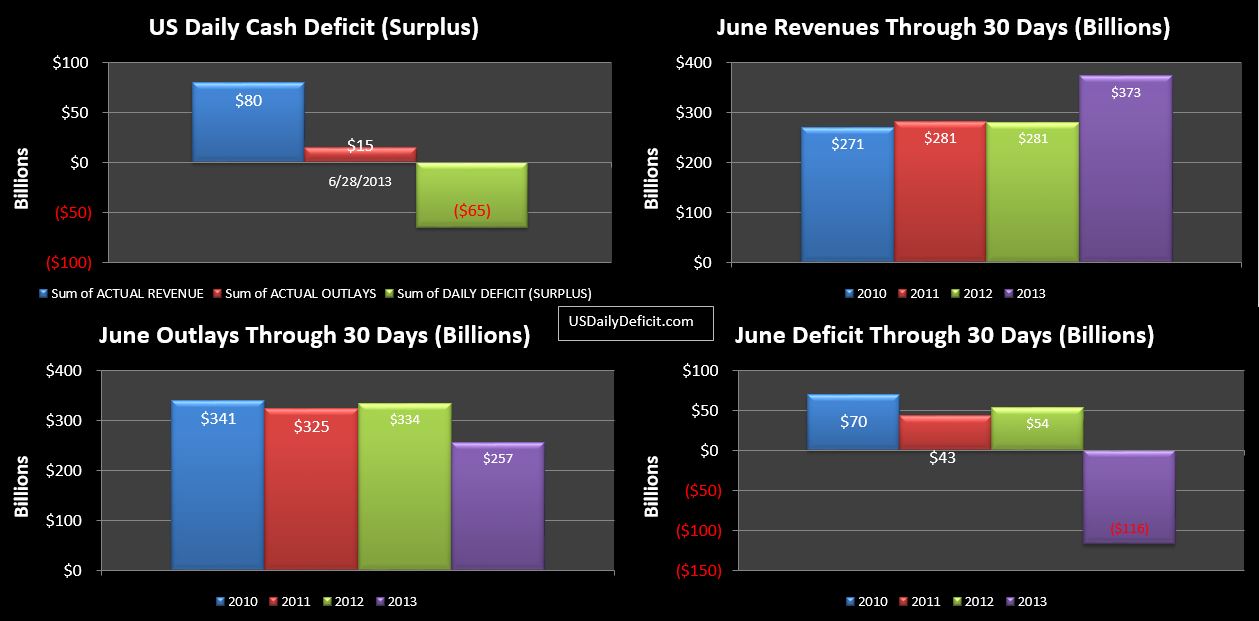
I’m running a bit behind schedule…what with the real job and everything 🙂 so I haven’t had a chance to put together a detailed write up for June, but I wanted to get the finals out there. So…The US Daily Surplus on 6/28 was $65.1B…thanks to the $66B “payday loan” from Fannie Mae. This brought the Monthly Surplus to $116B, a vast improvement over June 2012’s $54B deficit. Revenue up, cost down…pretty simple math. No doubt, it was a good month, but as we have been discussing all month…take out Fannie and about $65B of timing related to cost….and while it was still a good month….it wasn’t that good. Still…we’ll take it!!

Key takeaways…Tax deposits were up 9.5%. Taxes not withheld were up 16%. Corporate taxes were up 10%. Two months after the close of the January-April Tax season, excluding the Fannie Mae silliness, we see growth in net revenues stabilizing around 9% – 10%. Still…a very good number…pretty much in line with what you would expect after you raise taxes. But it does represent a material step down from the 15% we saw in the first four months of the year…recall my hypothesis…that the tax hikes drove many to pull income into 2012 to take advantage of lower rates….then they paid taxes on those gains in the first 4 months of 2013. If that is the case….rather than the 10-12% gains being expected by the CBO, 2014 could actually show declines over the first 4 months.

In any case…charts below, I’ll try to get out a more detailed analysis as time permits.

06-28-2013 USDD

6/27/2013 Daily US Cash Deficit

By | Daily Deficit

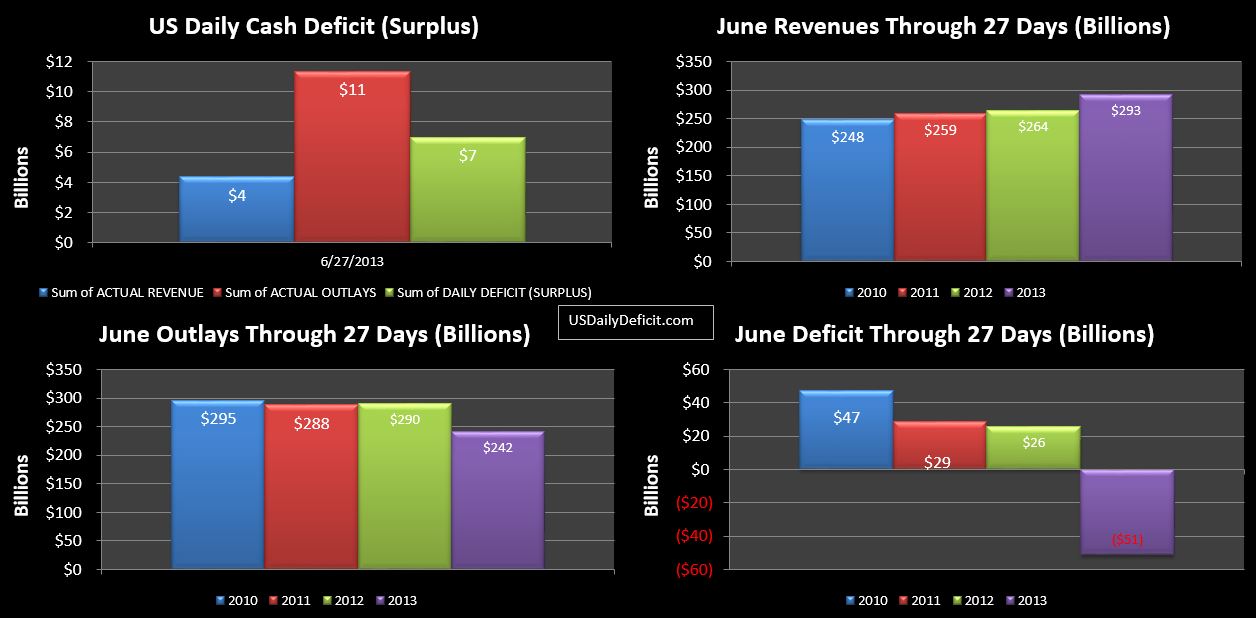
The US Daily Cash Deficit for 6/27/2013 was $7.0B dropping the June 2013 Surplus down to $51B with 1 day left.

06-27-2013 USDD

Tomorrow is going to be polluted with the extra 2012 payments and the Fannie Mae Funny Money in 2013, so this may be the cleanest shot we get at the fundamentals. So from this year’s 51B surplus, I would just subtract the $35B timing benefit to get down to $16B Surplus, a $42B improvement over last year. Not bad at all really. The real question is….what are we going to see next January. In theory, given constant rates, revenues should roughly grow in line with GDP and population growth…so maybe a few percent. If we are posting sub 5% YOY growth next year, lookout!!

6/26/2013 Daily US Cash Deficit

By | Daily Deficit

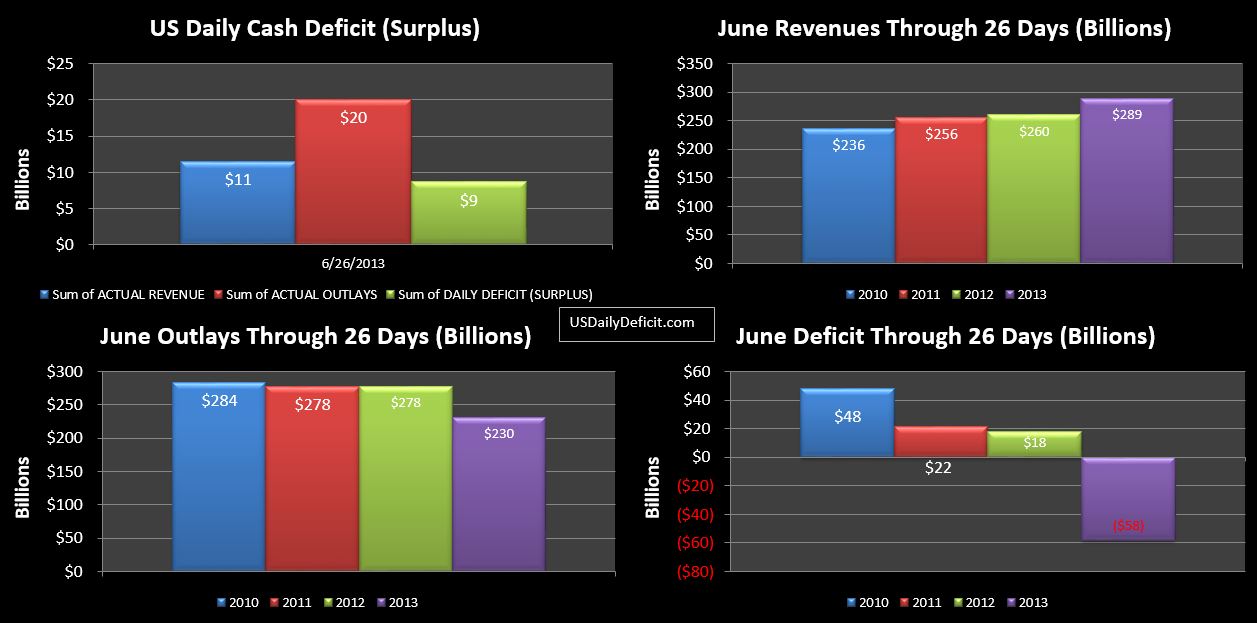
The US Daily Cash Deficit for 6/26/2013 was $8.7B….and was $3.8B on 6/25/2013, which I did not get a chance to post yesterday. With two days left the surplus is sitting at $58B for the month. With moderate deficits likely over the next 2 days, a $50B surplus would normally be a good estimate….not too shabby. However…supposedly a $60B or so payment from Fannie Mae is to be paid in June….though there seems to be no news on this for over a month. If it does happen, and I have no reason to believe it won’t…(it could be close to $70B with Freddie added in)…obviously the number could come in much higher…exceeding even my last guestimate of a $100B surplus by a healthy margin.

06-26-2013 USDD

Assuming nothing crazy happens(aside from the above)…never a safe assumption, Corporate taxes and withheld tax deposits are on track for 9% growth, while taxes not withheld appear to be honing in on +20%…a big swing from the -20% I was getting all worked up about last week 🙂