Category

Daily Deficit

7/09/2013 Daily US Cash Deficit

By | Daily Deficit

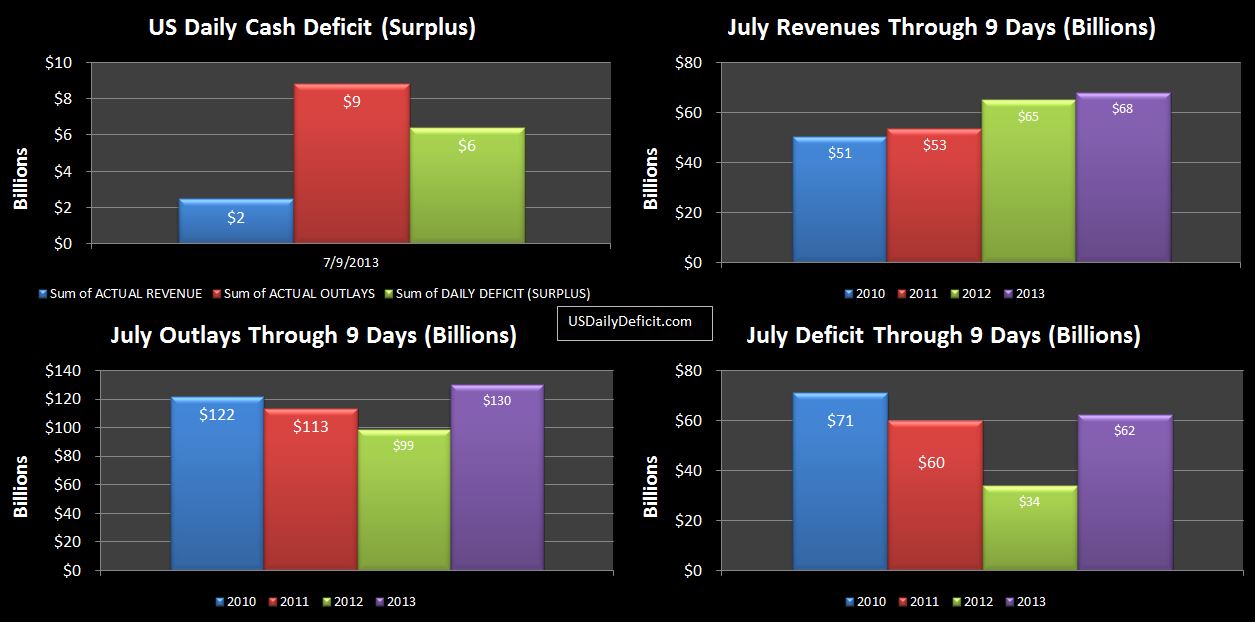
The US Daily Cash Deficit for 7/9/2013 was $6.4B bringing the July 2013 deficit through 9 days to $62B. Revenues were a bit light, even for a Tuesday, bringing down the YOY growth for the period below 5%, but it’s still early in the month, and strong finishes seem to be the pattern lately. Still…with the debt limit on the horizon….Treasury is going to need every last nickel to make it into October (and the new Fiscal year)…5% revenue growth will not get them there.

I don’t suppose it really matters in the big picture whether the default date is 10/3 or tomorrow….however, I suspect they want to get to the new FY because it will allow them to somehow shift some additional cost out of FY 2013 and into FY2014. This way….they can post a spectacular 2013 official deficit number, perhaps as low as $600B, and use this as evidence that Obama’s tax hikes and cuts are on path to fixing the deficit. Never mind the gimmicks…like the payday loan from Fannie Mae…getting a good 2013 number in the books gives Obama and the Democrats something to talk about all year long, even if it is unsustainable.

07-09-2013 USDD

7/08/2013 Daily US Cash Deficit

By | Daily Deficit

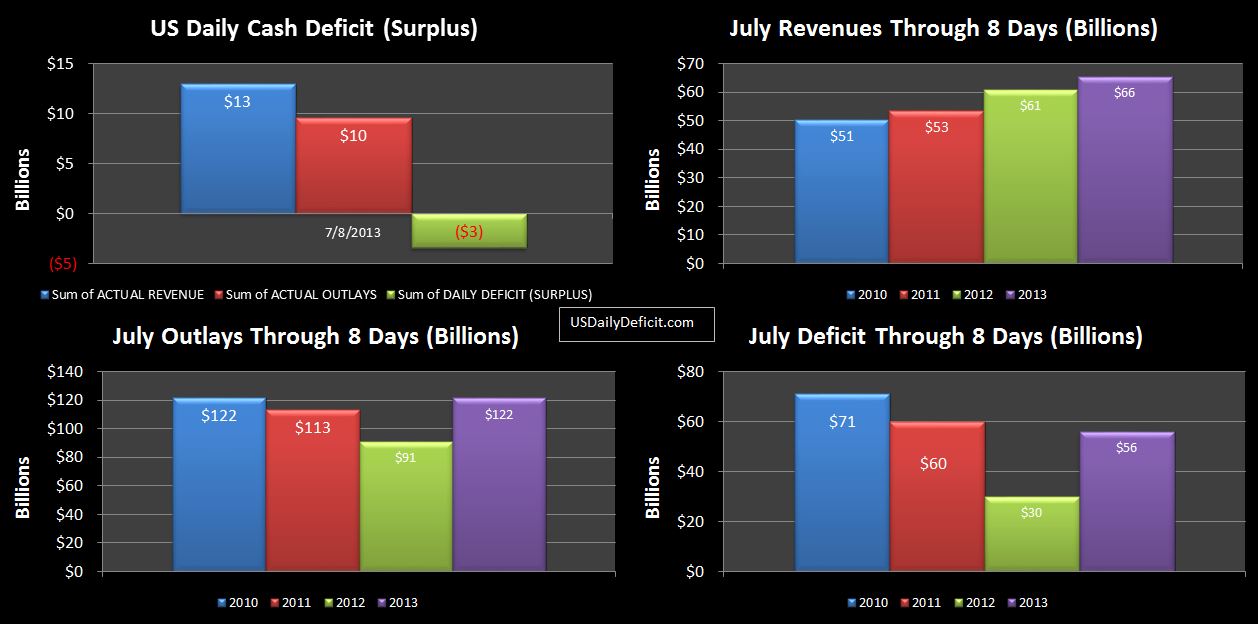
The US Daily Cash Surplus for 7/8/2013 was $3.4B on typically strong Monday cash receipts. Revenues are up YOY by 7%, but it will probably be a week or two before that firms up…. there can be a lot of variability. The rest of the month should be rather uneventful….just the large SS payments for the next 3 Wednesday’s, and some corporate tax deposits likely on the 15th. I still have my guess at around an $80B deficit to end the month, but I will revisit in a few weeks and we have enough data to make a better guess.

07-08-2013 USDD

We haven’t looked at this in a while, but the cash balance is now $92B. If we run another $25B for the rest of the month, we enter August with ~$67B….I am projecting about a $125B deficit for that month, leaving a $58B shortfall. however, Treasury has a knack for creating imaginary money and $58B…given their previous magic tricks…I have no reason to doubt they can come up with $58B to get through August somehow. If they get through August and the first few days of September…making it to October should be a breeze since September will see heavy cash inflows as a quarter end. That makes October the do or die month for the debt ceiling. At that point, cash will be down to near nothing, and we will be staring at a couple of $100B+ deficits in October/November….I don’t think they can squeeze $200B out of “extraordinary measures”…so Right now, I’ll peg the drop dead date at October 3rd at the latest….the day about $25B of Social Security payments need to be made. Just to recap….This assumes tax revenues continue to come in about 10% over last year, and that Treasury can squeeze another 60+B or so out of extraordinary measures between now and early September.

7/05/2013 Daily US Cash Deficit

By | Daily Deficit

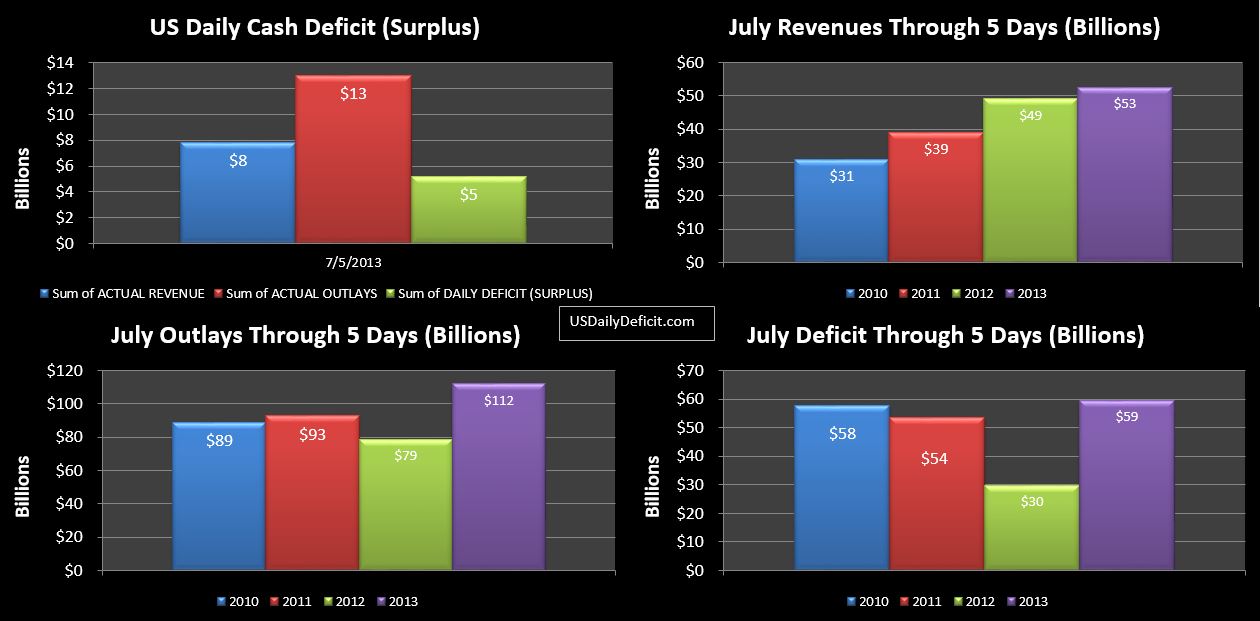
The US Daily Cash Deficit for 7/5/2013 was $5.2B bringing the July Deficit through 5 days to $59B. Although it’s only 4 business days, we have more or less a comparable full week to 2012…Revenues are up 7%. Cost…if we add back the $30-35B to July 2012 that was actually paid in June, we are pretty close to even. It’s still too early to tell, but 7% is a healthy gain so far (better than a decrease) and I would expect to build somewhat on that…especially with one extra business day over 2012 which we would expect to add about 5% or so of revenues and cost. So…looks like same old story…flat cost  and ~+10% or so revenue gains. It’s a really good story….let’s hope it doesn’t end soon.

07-05-2013 USDD

7/03/2013 Daily US Cash Deficit

By | Daily Deficit

07-03-2013 USDD

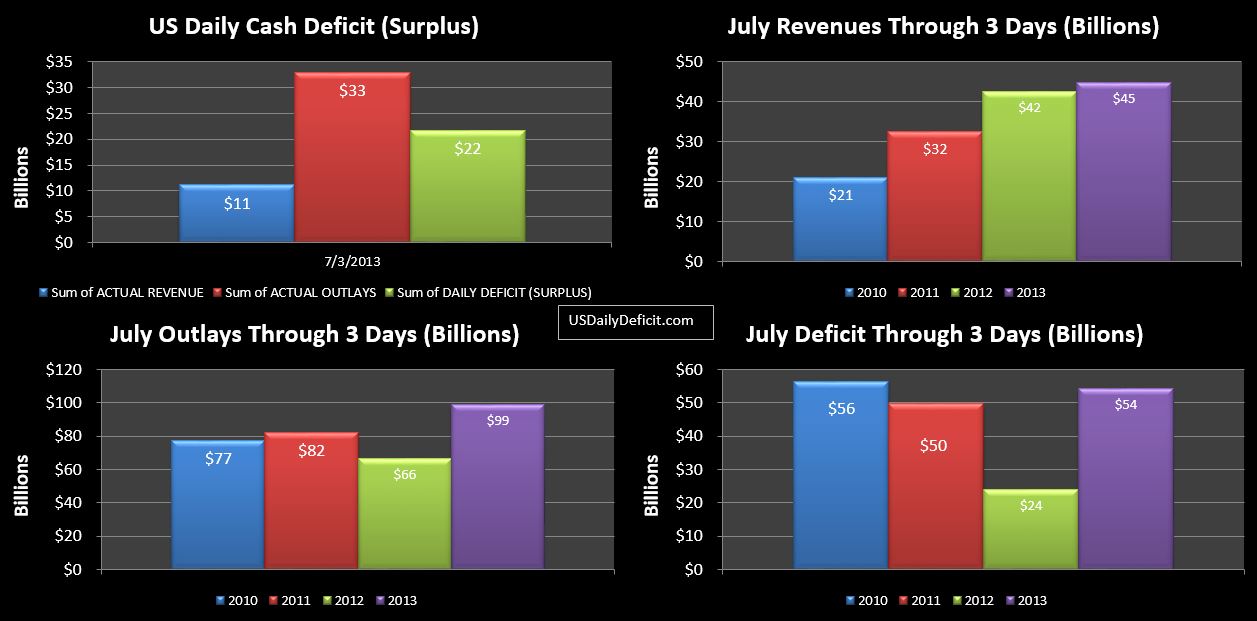
The US Daily Cash Deficit for 7/3/2013 was $21.7B on the first round of Social Security payments going out. The holiday timing is a bit off, so it will really be next week before we have a good comparison. Enjoy the Holiday Weekend!!

ObamaCare Delay And The 2014 Deficit

By | Daily Deficit

The delay in the Obamacare Employer Mandate has been in the news for a few days now, but one thing hasn’t been answered…how much will it cost? Surely the CBO will come out with an estimate sooner or later, but I thought I would take a wild ass guess now…then see how it turns out.

First…some background. The employer mandate is a $3000 penalty that businesses with over 50 employees must pay if they don’t provide health insurance for their employees. This was an important part of the initial financial case for Obamacare…these penalties were supposed to help offset the cost of the program, making it appear cheaper than it was.

So now…Obamacare will be implemented next year with all of the cost…but without some of the revenues (the individual mandate apparently will stand….bet you wish you had a lobbyist like big business huh 🙂 ) This article at money.com gives us some numbers to play with. Supposedly, only 70,000 businesses exist with over 50 employees that do not currently provide insurance. So…we know these companies have over 50 employees…let’s assume the average is 150, so 10.5M employees, at $3000 each, so $31.5B in lost revenues. Obviously…this is a wild guess with the key being the average # of employees. Maybe it’s 51, maybe it’s 1000. Guess we’ll have to wait for the CBO…hopefully they have a little bit better data to work with than I do.

Now…there are two big uncertainties in my mind about the 2014 deficit. The first is revenues. Will we see 10%+ growth again, low single digits, or even see a decrease? I really don’t know. If I had to guess, I’d probably say 5% growth, but there is enough uncertainty to blow up my forecast if I miss it.

The second is Obamacare. I’ve seen a few estimates ranging from $60B to over $100B per year.  Before this delay, I was pondering about the timing of the cash flows. For example, I would expect that the outflows would probably occur steadily throughout 2014 as incurred. The inflows….the penalties paid by employers and individuals….I would expect these to be paid in early 2015…as part of their 2014 tax return. This timing mismatch…if material, could in theory cause a spike in 2014 outlays, followed by a mini spike in 2015 revenues. I’m not really sure how to model it all at this point…I am really hoping that Treasury adds a  revenue and outlay line to the Daily Treasury Statement giving us a wealth of data to analyze…fingers crossed 🙂