Category

Daily Deficit

7/17/2013 Daily US Cash Deficit

By | Daily Deficit

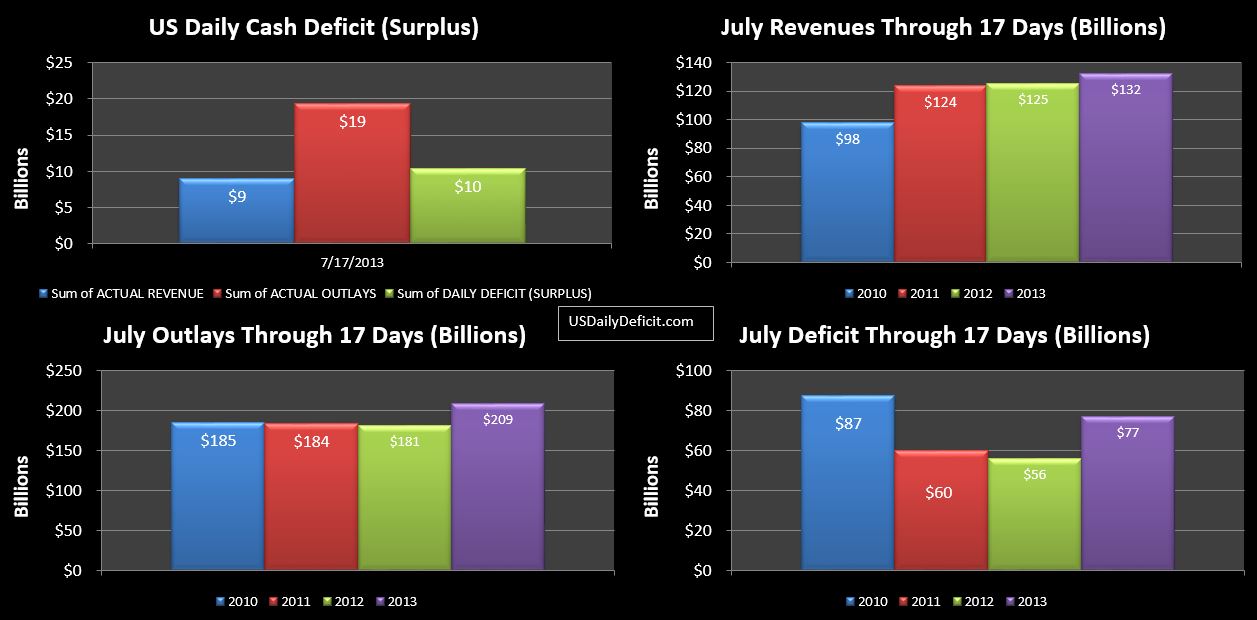
The US Daily Cash deficit for 7/17/2013 was $10.3B as round 3 of Social Security payments went out totaling $12B for the day, $48.8B for the month, with one large payment left next Wednesday. Comparing this year to last looks like about an 8% YOY gain…pretty much on par.

07-17-2013 USDD

Revenues still hovering between 5-6% YOY gain, so certainly within striking distance of the 10% we’ve come to expect. On the deficit…we are $21B worse off than last year…primarily due to timing. However…I had been expecting us to more or less match last year’s $82B deficit nonetheless…on higher revenues and lower costs. But…with 10 days left…historically we should expect to see a ~20B deficit over the rest of the month…putting us closer to $100B. I’m not changing my estimate yet, but it is looking less likely by the day.

7/16/2013 Daily US Cash Deficit

By | Daily Deficit

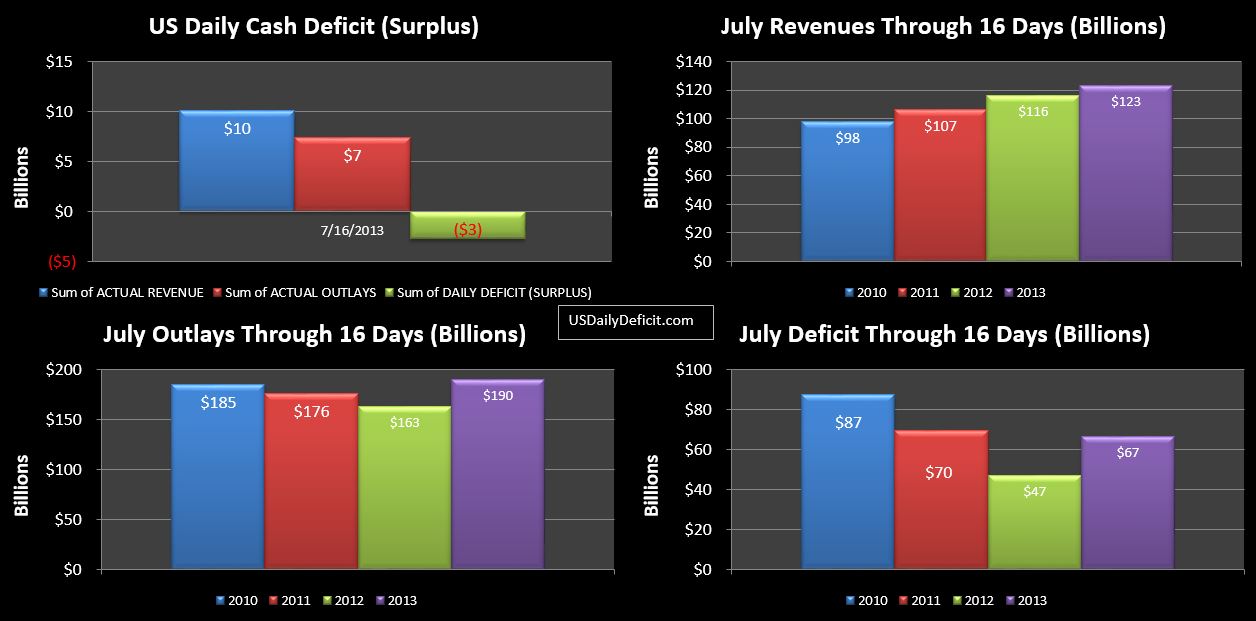
The US Daily Cash Surplus for 7/16/2013 was $2.7B pushing the July 2013 Deficit through 16 days to $67B with 11 business days to go. Strong revenues came through… a bit odd for a Tuesday, giving 2013 the revenue bump it had been needing, now showing a 6% YOY gain…up from 0% just yesterday. All in all…a very good day…a few more of these and we’ll be back on track to continue the 10% YOY gains

07-16-2013 USDD


7/15/2013 Daily US Cash Deficit

By | Daily Deficit

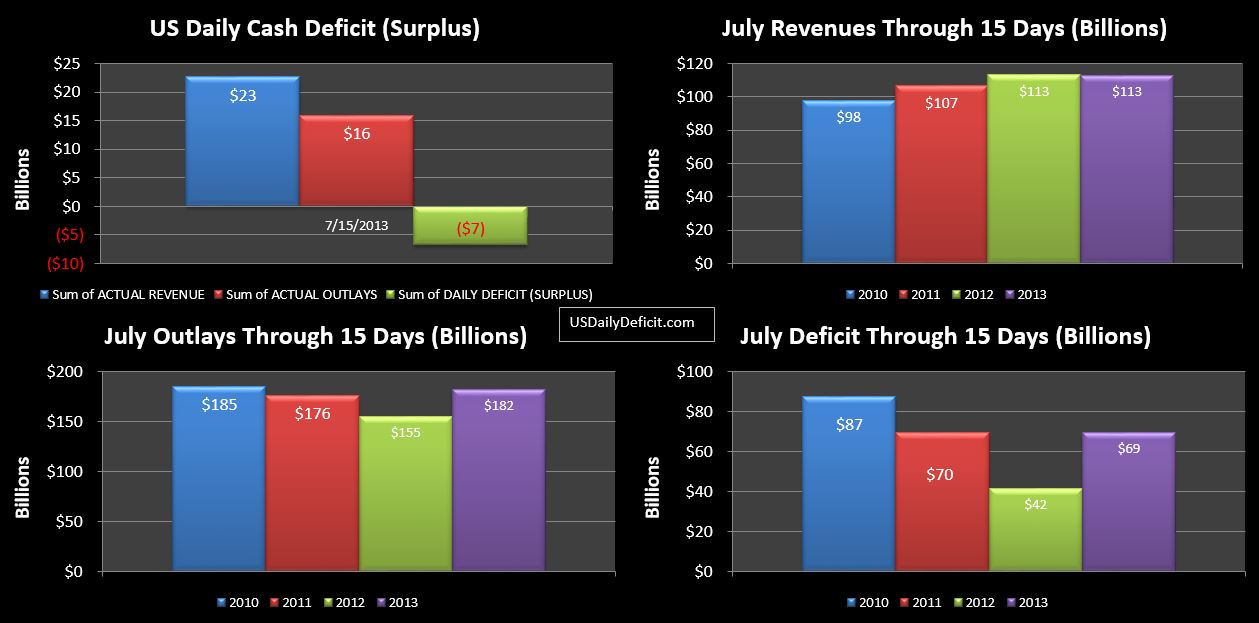
The US Daily Cash Surplus for 7/15/2013 was $6.8B bringing the July 2013 Deficit through 15 days to $69B. Today was the big day for corporate taxes….they were up, but only 2% vs the comparable day last year (7/16/2012). It is possible we see some receipts tomorrow that build on that, but definitely no fireworks yet..

07-15-2013 USDD

Revenues are now actually down just a bit, but essentially flat YOY. Mathematically…the rest of the month will need to run +20% just to end up at the +10% we have come to expect. Clearly this is possible….we’ve seen it before.


7/11/2013 Daily US Cash Deficit

By | Daily Deficit

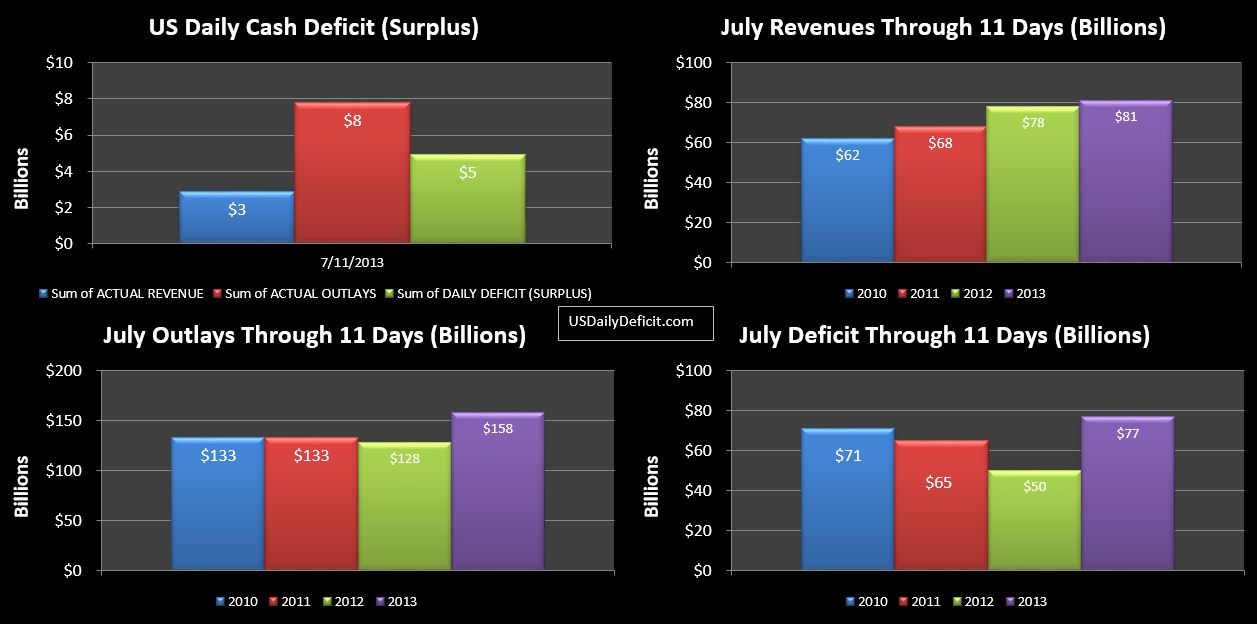
The US Daily Cash Deficit for 7/11/2013 was $4.9B bringing the July 2013 deficit through 11 days to $77B. Revenues are still trending low at 4% YOY gain. Next week could bring a change in fortune, as the 15th usually brings a spike in revenues….hopefully it will be enough to bring that YOY back up to 10% or so.

07-11-2013 USDD

There is one interesting data point I would like to point out…business tax refunds are up 77% from ~$1.1B to ~$1.9B compared to last year. At less than $1B, it’s really not material, just interesting. So far, gross corporate taxes recieved are down a bit, but essentially flat YOY…we’ll know by the end of next week if the refunds numbers are an ominous sign that corporate taxes are headed down, or if it is just an immaterial timing blip.

7/10/2013 Daily US Cash Deficit

By | Daily Deficit

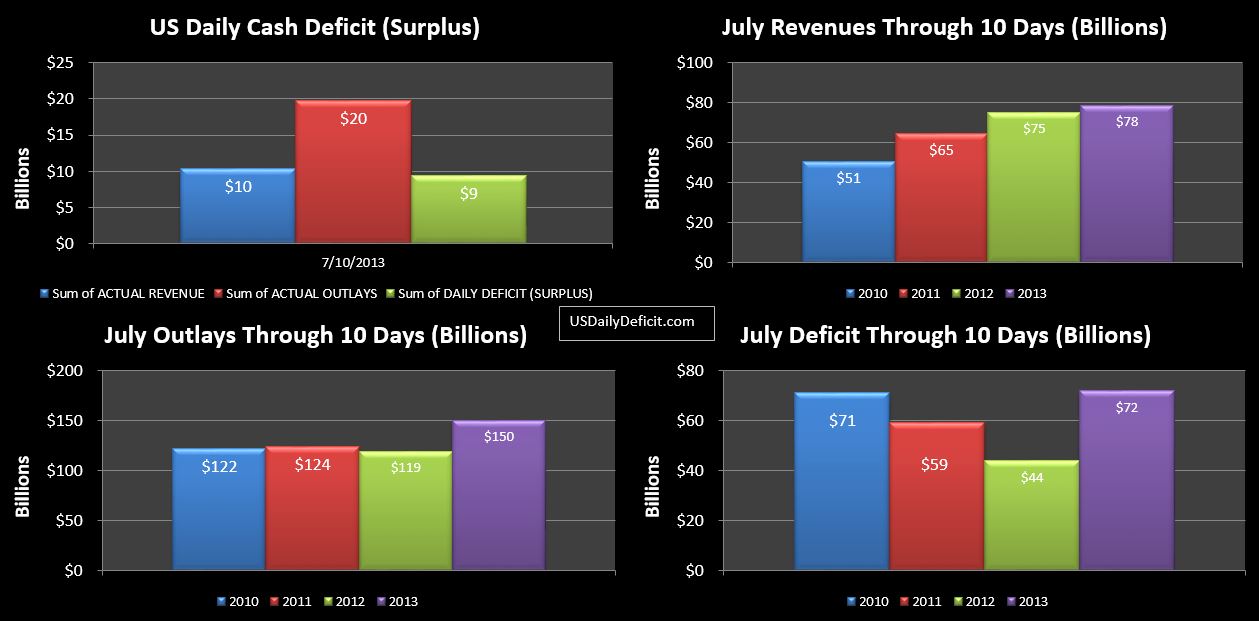
The US Daily Cash Deficit for 7/10/2013 was $9.5B pushing the June deficit through 10 days to $72B. With 1/3 of the month gone…revenues are up a meager 4%. This will be helped some by an extra day vs 7/2012…perhaps as much as a $10B (or 5%) bump, but August should give that right back. Outlays…adjusted for timing look more or less in line with last year, perhaps a few billion lower.
07-10-2013 USDD

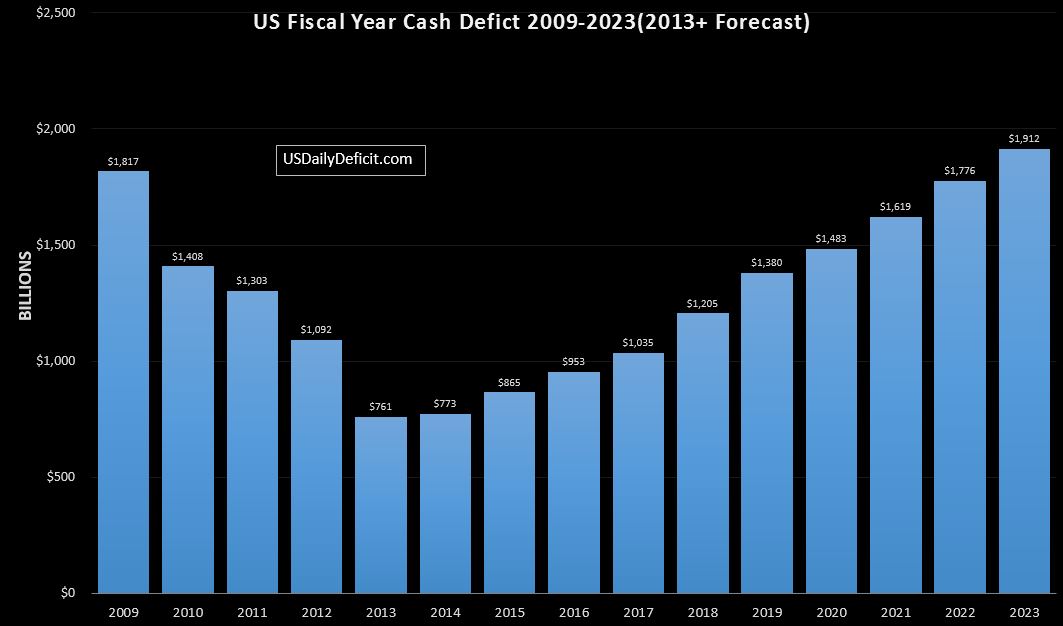
Over at money.com Jeanne Sahadi has a front page article that is trending U.S. books $117 billion surplus in June. It’s not a terrible article, but the ignorance displayed in the comments section is a bit frightening. Everybody thinks we are saved….We aren’t. No doubt, 2013 is going to be a material improvement, but it is still going to be a $700-$800B deficit. So yeah…it’s great that we aren’t blowing through $1.6T per year anymore like we were not that long ago…. but $800B per year…with $17T accumulated…no matter how you look at it…that’s a huge hole, and we’re still digging at a ferocious pace.
07-10-2013 USDD-FC Deficit 2013-2023

Above is the latest output from the model I use. We can see clear and steady improvement from 2009 forward as revenues picked up and cost was more or less held constant. There is no rocket science in the model. After spiking 12% or more in 2013 on tax hikes, I assume most revenues will grow at 5% in 2014 and 4% from there on…more or less in line with historical patterns. On the cost side, I assume 2% or so annual growth from 2014 on for most outlays, with a few notable exceptions. Social Security grows at 6-7%, and interest grows along with debt outstanding, but it held at about a 1.8% effective rate…extraordinarily low. For Medicare, Medicaid, and the Affordable Care Act, I use the CBO’s numbers. Using these fairly simple, and I believe realistic assumptions, I show we bottom out in 2013/2014 on increased revenues, before heading back up as spending increases on Social Security, Interest, and Healthcare outpace and run away from the modest annual revenue gains. Note…this all assumes no recesions, crashes, wars ect… although historically, it seems quite unlikely we will go another decade with out some kind of economic disturbances. I guess what I am saying is tis may end up being a conservative forecast unless the CBO is correct, and we manage to string together a few more years of 10%+ revenue gains. We all know anything is possible, but historically, it seems quite unlikely. Guess we’ll have to wait and see.