Category

Daily Deficit

September 2013 Deficit Preview

By | Daily Deficit

While we await the August final deficit numbers, I thought it would be a good time to take a look at what September has in store for us.

As a quarter end month, we should see some strong revenues around the middle of the month as corporate taxes and taxes not withheld from paychecks are remitted to Treasury. All in, we will likely see about $100B more revenue in September than we did in August, resulting in a monthly surplus of about $70B, though this is still using some pretty healthy YOY revenue assumptions more in line with what we saw in the first half of the year. Given that the last two months have shown a marked decline from those initial rates, this $70B surplus could be a bit optimistic if we continue to see sub 10% YOY revenue growth.

On the outlays side, against the backdrop of sequestration, we would typically expect a  2% or so decrease in outlays…primarily from defense vendors. However, September 2012 managed to push $25B of SS outlays into late August…September 2013 will not have this benefit, and thus, we will probably end up seeing higher YOY outlays over the month as reductions in outlays will not be large enough to offset the timing issues.

For reference, September 2012 posted a $58B surplus, so within the margin of error of what I am projecting for September 2013. The key here, as it has been for most of the year is to keep our eyes on revenues, which could range from +5 to +20%. Outlays are far more stable (and predictable)…adjusting for timing, they will probably be down a few%.  We should know by about 9/21 how the revenue story is shaping up… Stay tuned!!

US Daily Cash Deficit 8/29/2013

By | Daily Deficit

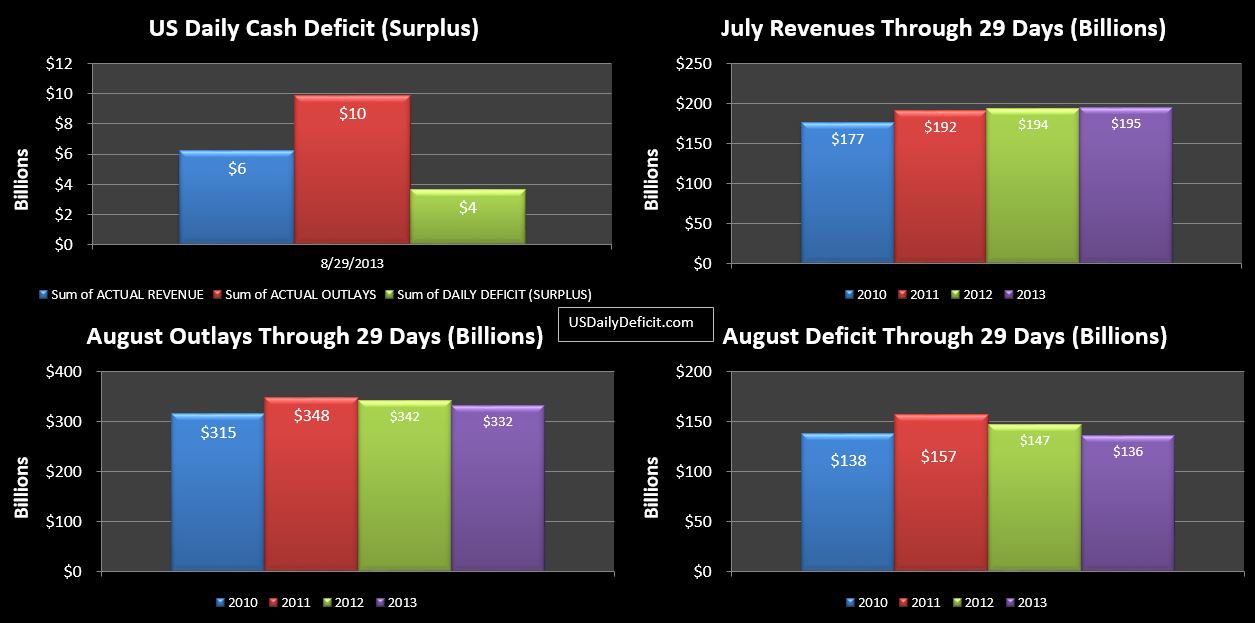
The US Daily Cash Deficit for 8/29/2013 was $3.6B bringing the August 2013 Cash Deficit to $136B with one business day remaining.  Revenues finally surpassed the pace set by last year by $1B, and another $10B or so on 8/30 would put us at YOY growth of a meager 1%. For reference, the first 6 months of 2013 ran at +18%, and July came in at +9%.

Interesting…. though I am inclined to average them together….at 5% revenue growth. This, to me, seems like what may emerge as the new normal…not the 11-12% the CBO has forecast for the next couple of years. With a $3T annual revenue baseline, the difference between 5% and 11% growth is about $200B in 2014 and $400B in 2015….and it grows exponentially from there.

08-29-2013 USDD

With one day remaining….expect a $30-40B deficit tomorrow (well…8/30) substantial, but less than the $64B deficit posted on Friday 8/31/2012, since that day included ~$25B of SS payments due 9/3, but pulled forward due to Labor Day.

Outlays are worth noting today since come tomorrow they will be thrown out of sync….are down $10B. Just scanning through the categories…Defense vendor payments are down $6B and Education Dept outlays are down $3B, with other categories having smaller variances up and down. $10B is a 3% reduction YOY….not too shabby given the offsetting increases in Social Security…but unfortunately, I don’t see this trend lasting beyond the fiscal year end. That said…I didn’t think sequestration would stand, and I was wrong (though pleasantly surprised) on that.


US Daily Cash Deficit 8/28/2013

By | Daily Deficit

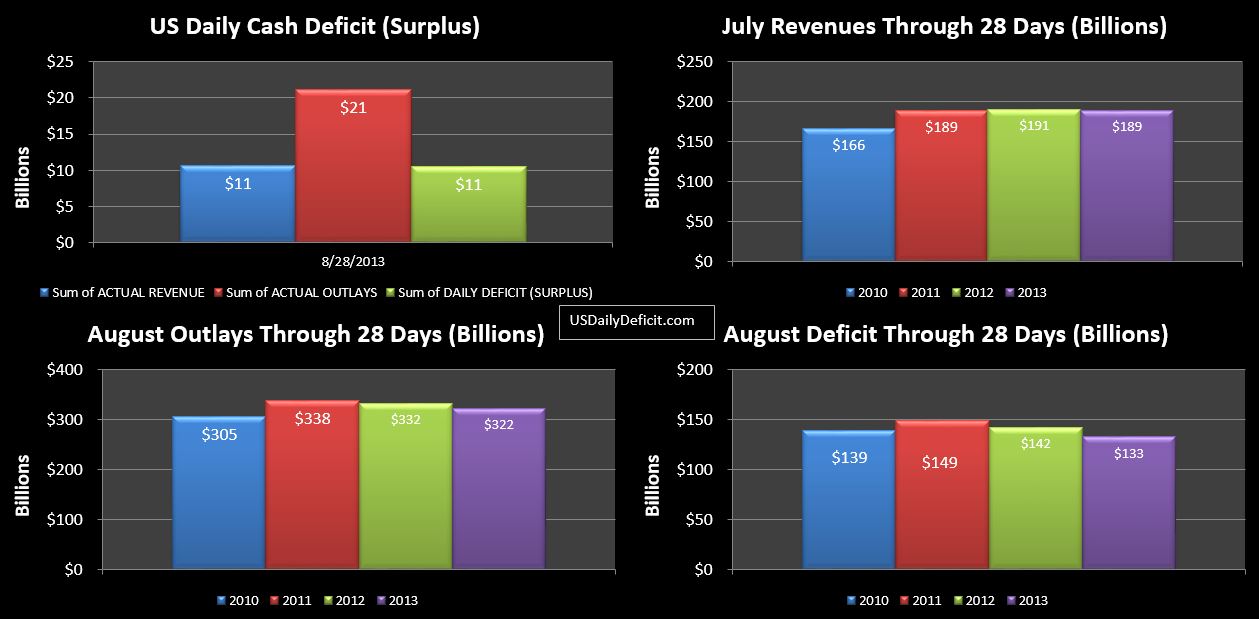
The US Daily Cash Deficit for 8/28/2013 was $10.6B bringing the August 2013 deficit through 28 days to $133B with two business days remaining. $12B of Social Security payments went out today…the last payment of the month, bringing August 2013 and 2014 as close to in sync as they have been all month. Revenues are back down YOY $2B under last year’s pace, but there is a good chance they will catch back up tomorrow as a few $B of excise taxes are likely to trickle in. Outlays are also down $10B, resulting in the deficit being down $9B(rounded) vs last year. Without a doubt…improvement is a good thing…we’ll take it…but this kind of meager improvement is substantially less than we have become accustomed to seeing.

08-28-2013 USDD

So…with two days to go…expect a small deficit for Thursday, followed by a large Friday deficit…likely in the $30-$40B range as September payments get pulled into August by the timing of the weekend and the Labor Day Holiday. Thanks to the holiday, we won’t have our final August numbers until next Tuesday 9/3, but I don’t mind waiting.

US Daily Cash Deficit 8/27/2013

By | Daily Deficit

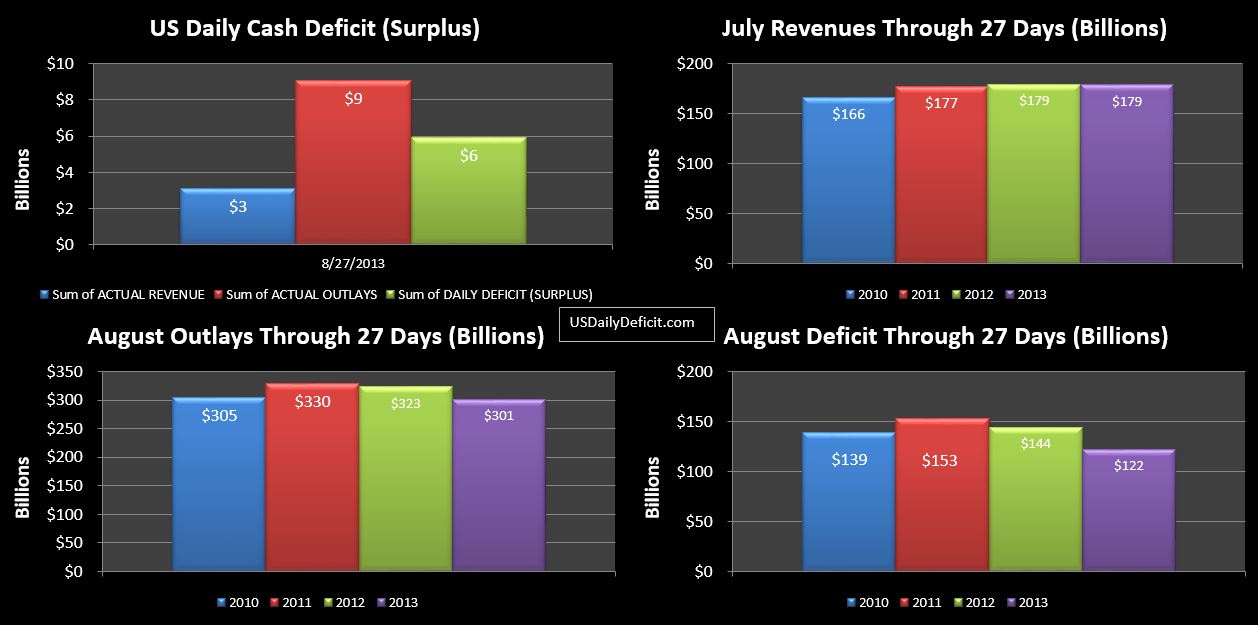
The Us Daily Cash Deficit for 8/27/2013 was $5.9B bringing the August deficit through 27 days to $122B with three business days remaining. Revenues have finally pulled even to August 2012’s pace at $179B…likely on track to edge out August 2012’s $204B of revenues by a few billion or so.

08-27-2013 USDD

With three days left…August is looking like a big disappointment…with flat revenues, and adjusted for timing, more or less flat cost….where we are really looking for +10% revenues and 1-2% reduction in outlays to match earlier month’s performances. This would make two in a row…though we should probably average them together….I’ll do that once the finals are in. Obviously…if August ends like that…it won’t be a good thing, but September Revenues is what I am most interested in. Quarter ends are always stronger in revenues….and subject to more uncertainty. If we see solid YOY revenue gains across the board…it will be good news…or at least more of what we’ve seen over most of 2013. If…however, revenues disappoint for the third month in a row, it will be a pretty good sign that trouble’s a brewin…and the pony ride that the first half of 2013 has resembled is just about over.

US Daily Cash Deficit 8/26/2013 – With Debt Limit Countdown Calculations!!

By | Daily Deficit

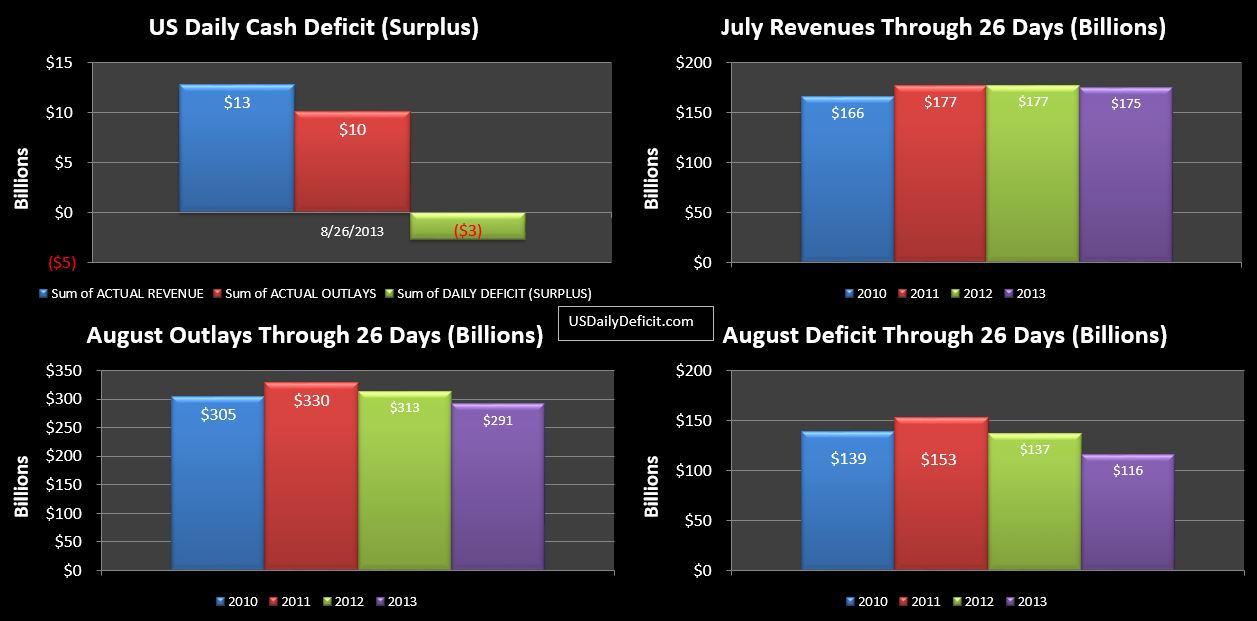
The US Daily Cash Surplus for 8/26/2013 was $2.7B bringing the August deficit through 26 days to $116B with four business days remaining. My original deficit estimate was $155B, and we are certainly within striking distance. We need $39B to get there. Tuesday-Thursday will likely average around $5B per day….meaning a 24B deficit on Friday would get us there. For reference…the deficit on Friday 8/31/2012 was $64B…but it included $23B of Social Security payments slated for 9/3/2012…Labor Day. This year, Labor Day is on 9/2, so the 9/3 payments of about $25B should go out in September…rather than being drawn into August like in 2012. So…absent surprises, the August Deficit is looking to end around $155B to $170B or so.
08-24-2013 USDD

Cash in hand is now down to $42B…less than the expected cash deficit over the next four days…..which of course means Lew will need to use his “extraordinary measures” (EM) to create some cash out of thin air. While there are multiple elements to EM, the accounting is straight forward. They simply pretend that some of the existing debt does not exist…which lowers the official debt outstanding…allowing them to issue more debt in exchange for cash….and thus keep funding the government despite the debt limit. Yes it’s shady…it basically changes the debt limit to… debt limit +$300B or so. Last time we had an extended debt limit fight like this was between May 2011 and August 2011. The day after the debt limit was raised…debt outstanding increased $239B…as the Treasury made the necessary journal entries to make all the outstanding “EM” show back up on the balance sheet.

The latest from Lew is that the “for real” debt limit will be hit in Mid October. So…lets back into that. We started playing this little game back on 5/20 with a cash balance of $34B. For the remainder of May, we ran a $58B deficit, followed by a $116B surplus in June thanks mostly to our buddies at Fannie Mae coming through on our payday loan. then came July with a $90B deficit, and through 26 days of August, we have another $116B on the books. Add it all up, and absent EM, we would have a cash balance of about $-114B instead of the +42B we actually have, indicating EM to date of about $156B…

I recall reading somewhere that extraordinary measures gave them $260B of headroom….indicating that they have about $100B left. Lets say we run another $50B over the next 4 days…we end August with 50B of EM in the tank, and $42B of cash (or some combination of the two)…$92B. After a weak start, September should recover as revenues start pouring in mid-month as quarter ends usually do…My preliminary estimate for September is a $60B surplus…pushing the $92B cushion up to $152B by the end of September. From there…I have the October Deficit at $97B and the November Deficit at $130B. So with this set of facts and assumptions…I would put it at early to mid November versus Lew’s mid October. That said…any errors in these values would push the date forward or backward. For example…if the true amount of EM left is only $50B, and my October deficit forecast is $20B low…I could see a mid October date, and honestly, I have no reason to think my simple model is in any way superior than Lew…who likely has far superior data and a crack team of government analysts updating the forecast hourly.

In the end, I suppose it really doesn’t matter what the date is. The big picture is this… We have $17T of debt, and while the 2013 deficit will show a material improvement over 2012 (down from $1.1T to ~$750B)…this is likely a bottom…with steady increases from here on out.

Interesting fact…the distribution of the deficit over the fiscal year has become extremely asymmetrical…which is what has enabled the Treasury to draw this debt limit battle out all summer and apparently into fall. Using actuals for FY 2013+ estimates for August and September, it looks to me like a full 85% of the deficit will have been incurred in the first half…October 2012-March 2013. We are still looking at huge deficits…in the $700-800B range, but they are not evenly distributed…making it easy to skate by on EM during the second half of the fiscal year. So…when you hear all those amazing stories about the debt outstanding being the same for 100+ days…when you look at the detail…it’s really not that amazing. Shady…yes, but completely explainable 🙂