Category

Daily Deficit

US Daily Cash Deficit 11/7/2013

By | Daily Deficit

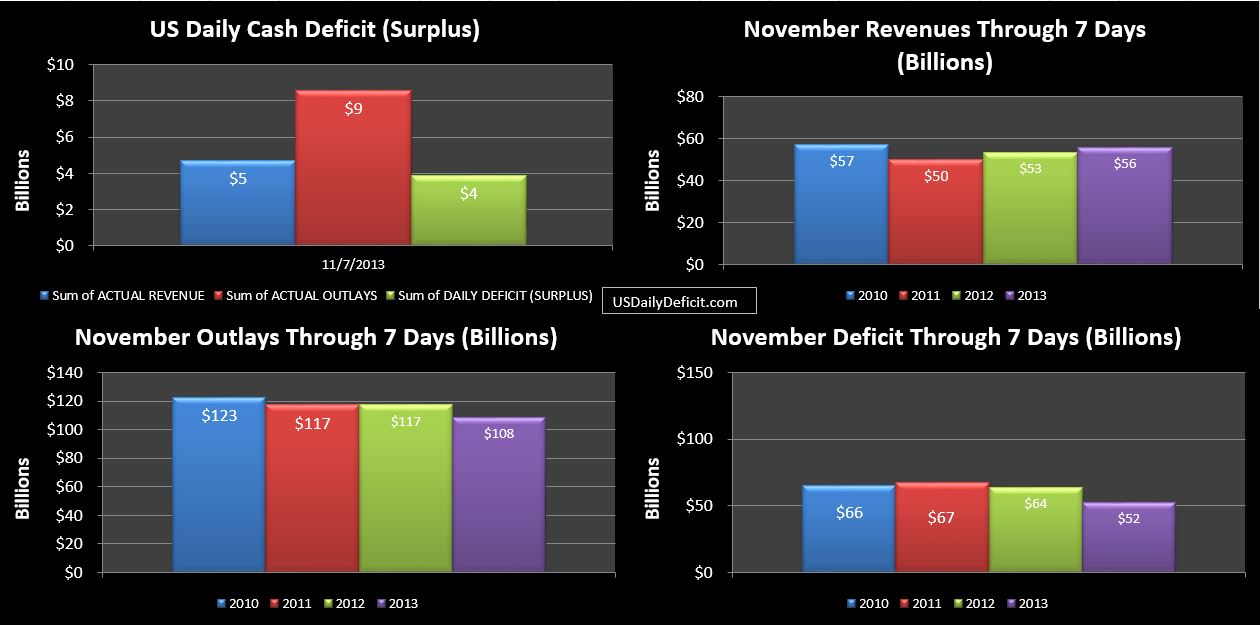
The US Daily Cash Deficit for Thursday 11/7/2013 was $3.9B bringing the November 2013 cash deficit through 7 days to $52B, $12B under the 11/2012 benchmark through 7 days of $64B.

11-07-2013 USDD

Revenues continue to look solid currently at +5% YOY and gaining. Outlays still look weak, though they may make up some ground next week.

I was poking through the data and found it very interesting to compare the YOY change in revenues over the course of the year. For the first six months of 2013 we saw phenomenal YOY revenue growth at +18%. Over the same period we also saw outlays decline 3%. However….compare that with July-October with revenue up only 9% (still impressive…but not +18%) and outlays at +1%. It seems pretty clear that the tax avoidance timing and the Fannie Mae games have been flushed out, and a lower baseline has emerged.

Come 2014…I suspect a new baseline will emerge…certainly for revenues which will not have the benefit of a Jan 1 SS tax hike to pad their stats, and perhaps even for outlays. For example, by the end of 2013, payments to defense vendors will likely be down about 11%, or $45B below 2012. What will 2014 bring? Another $45B cut, or have we reached a new baseline? The second $45B is going to be a lot harder to cut than the first, so stay tuned. There is no doubt that 2013 is making some significant headway in decreasing the annual deficit, but I am still doubtful that progress can be maintained in 2014 and beyond. Hope I’m wrong 🙂
US Daily Cash Deficit 11/6/2013

By | Daily Deficit

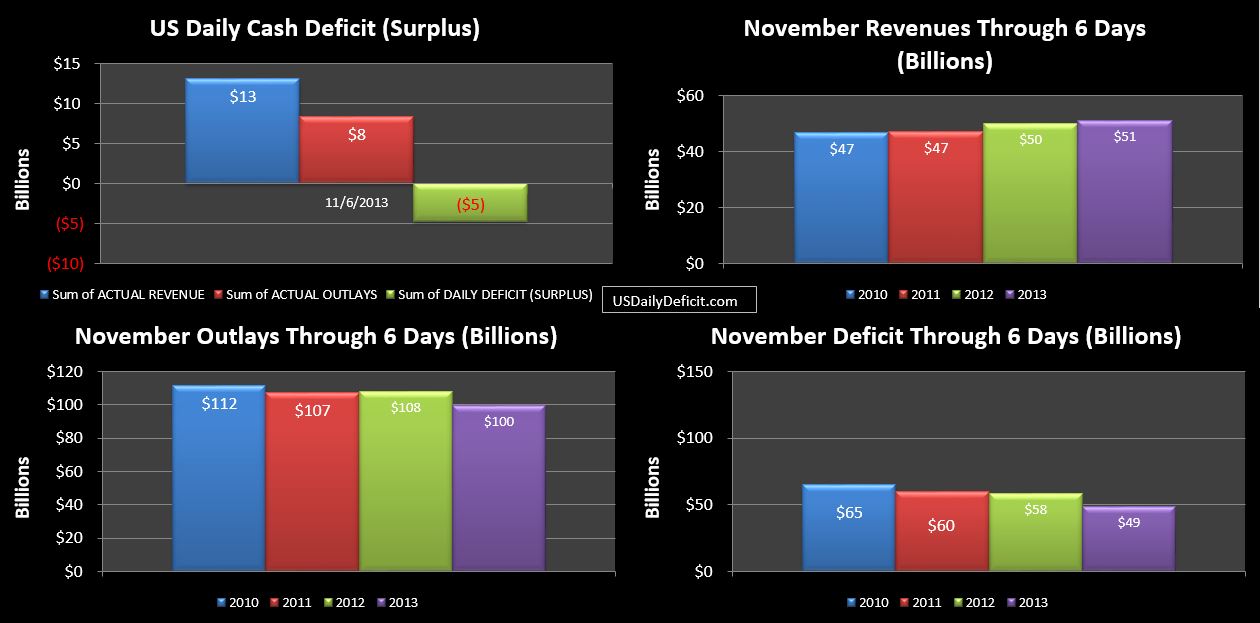
The US Daily Cash Surplus for Wednesday 11/6/2013 was $4.7B, pulling the November 2013 deficit through 6 days down to $49B.

11-06-2013 USDD

Through 6 days, there is really nothing to note other than revenues look good…being up a bit over 2012 despite being down a business day. Outlays are also down….which is likely attributable to one less business day, but we would more or less expect the gap to narrow over the rest of the month (but you never know). Also note that SS payments go out on the 2nd-4th Wednesdays of the month. Since this is the first Wednesday…no payment. The first SS payment (~$25B) goes out on the 3rd, unless that falls on a weekend or holiday, which is why they went out 11/1 this month.

On deck….we have a federal holiday Monday….$12B of SS payments next Wednesday, then about ~$30B of interest payments on 11/15, so we could be knocking on $100B by the end of next week.

November 2013 Deficit Preview

By | Daily Deficit

Although I’m a few days late, it’s time to make the November deficit forecast. Now…before I do, I think I should take a moment to toot my own horn….In October, I forecasted a $91B deficit and actuals came in at $87B….marking my best performance to date over the last five months (which is how long I’ve been doing a “formal” preview). The biggest miss was $18B in August and the average is 11. So…skill??? Probably not. We’ll chalk this one up to luck.

Remember…all we are doing here is taking a look at historical revenues and outlays by category and using that historical data to make a current forecast. For most categories, it’s just a matter of multiplying last year’s number by an increase or decrease that matches the trend. For example…last November, federal tax deposits were $145.408B. For 11/2013, I am forecasting $161.403B… an 11% increase, which is in line with the trend for this category. Moving out to this next January, my current forecast drops that growth down to 6%, though honestly I don’t really know what to expect…it’s essentially a whole new world.

So you can see, it’s not rocket science, but it is a bit tedious, especially once you start trying to adjust for timing. With 12/1 falling on a Sunday….a big chunk of those 12/1 expenditures like Medicare, Military Pay, pensions ect…all get pulled into November causing a headache, but it’s not too bad if you have the historical data to make appropriate adjustments.

So, while admitting November is a bit chaotic, and that I am unlikely to match my October success, I’ll go ahead and throw my dart. Revenues will end up at $202B(vs $180B 11/2012) and outlays will come in at $362B (down from $368B), good for a $160B cash deficit in November 2013…. a $28B improvement over last November.  Happy Thanksgiving…hope you enjoy your household’s $1,400 share of the monthly deficit!!

US Daily Cash Deficit 11/4/2013

By | Daily Deficit

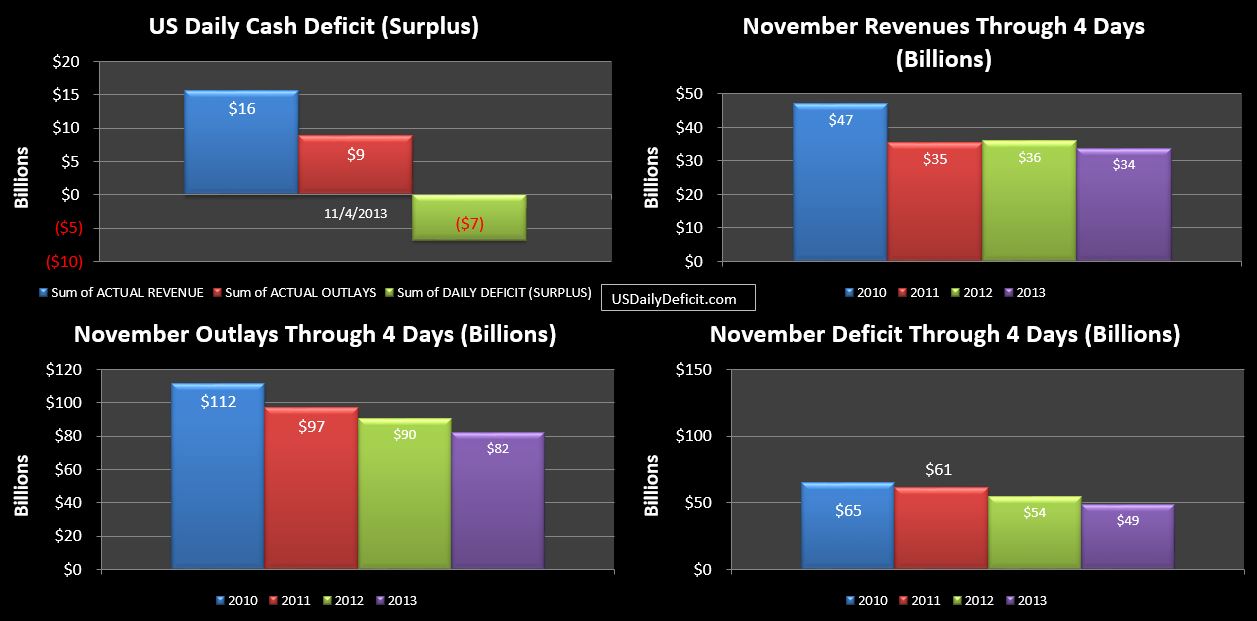
The US Daily Cash Surplus for Monday 11/4/2013 was $6.8B, following up 11/1’s $55.6B deficit that I did not get a chance to post.

11-04-2013 USDD

It’s really too early to make too much of the charts, but 4 days in, nothing is really standing out. Note that as I typically do…I have synchronized 2013 and 2012 to give us more relevant YOY comparisons. November 2012 has an extra business day….it started on a Thursday, while 2013 started on a Friday. This makes the sync fairly easy…I’ll just give 2012 the extra day from the beginning, and other than the holiday, everything else should fall into place. So today’s chart is comparing 3 business days of 2012 ending on Monday 11/5 to 2 business days of 2013…ending Monday 11/4. Revenues and outlays are primarily driven by day of week patterns, so while not perfect…it’s as good as it’s gonna get, and by the end of the month, that extra day will be more or less immaterial.


October 2013 Cash Deficit

By | Commentary, Daily Deficit

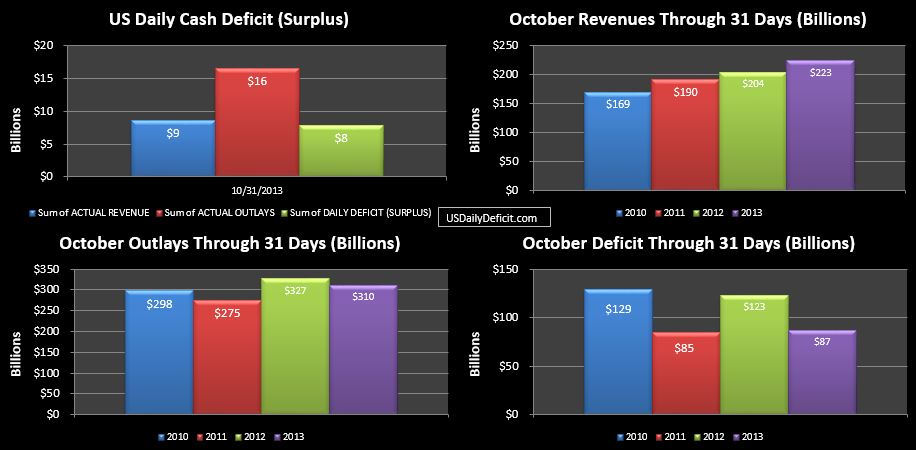
The US Daily Cash Deficit for 10/31/2013 was $7.9B bringing the October 2013 cash deficit to $87B for the month. There is no doubt that this is a material improvement over last year’s $123B deficit, but as discussed in the October preview where I forecasted $91B, it was not exactly  unexpected.

10-31-2013 USDD

Revenues ended up at $223B just shy of my $225B forecast despite about $4B of help from what I assume to be delayed tax refunds. It was still a good number though, representing a 9.5% YOY increase which is pretty close to what we’ve come to expect in 2013.

Outlays ended up at $310B, a $17B decrease over 2012, though about $5B of that was due to timing. The rest…I still have to believe much of it is simply delays in payment and expenditures caused by the 16 day government shutdown. We saw some catch up in the last week, but absent timing issues, we normally expect to see pretty flat outlays…with increases in entitlements being more or less offset by sequestration cuts elsewhere in the budget. I could be wrong….If November is down big as well, that hypothesis may need to be discarded.

As a whole…October was a good month in what has without a doubt been a good year. Revenues up, outlays down….that’s a pretty simple formula for success and honestly I expect more of the same for the remaining two months of 2013. But 2014 will bring us into new territory. Creating a one year blip is not exactly rocket science. Raise taxes…hold spending flat…which is exactly what has happened. Through 10 months 2013 revenues are up a thoroughly impressive 14% and outlays are down 1%.

But come 2014…there are no new tax increases on the horizon…, and Obamacare is poised to wreck havoc on both sides of the ledger…depending on how they decide to account for it. For example…the Obamacare subsidies are technically tax rebates…which I generally treat as “negative revenue”. However…they will be paid directly to insurance companies….so I really have no idea how they will be reported on the DTS…if at all. Penalties, which would show up as new revenues are minimal, and from what I can tell wouldn’t be paid until April 2015 anyway…. then there is the expansion of Medicaid…which I would expect to show up in January 2014…adding billions per month of outlays to that program. All in…it’s a lot of moving pieces which makes it extremely difficult to forecast what will happen…..guess we’ll know in a few months.

What I suspect is that after topping out in 2009 at $1.6T…4 straight years of material improvement end in 2013 at about a ~$700B annual deficit(which is still absolutely terrible by the way). From there…it will stabilize for a year or two before shooting to the moon by the end of the decade.