Category

Daily Deficit

US Daily Cash Deficit 12/31/2013

By | Daily Deficit

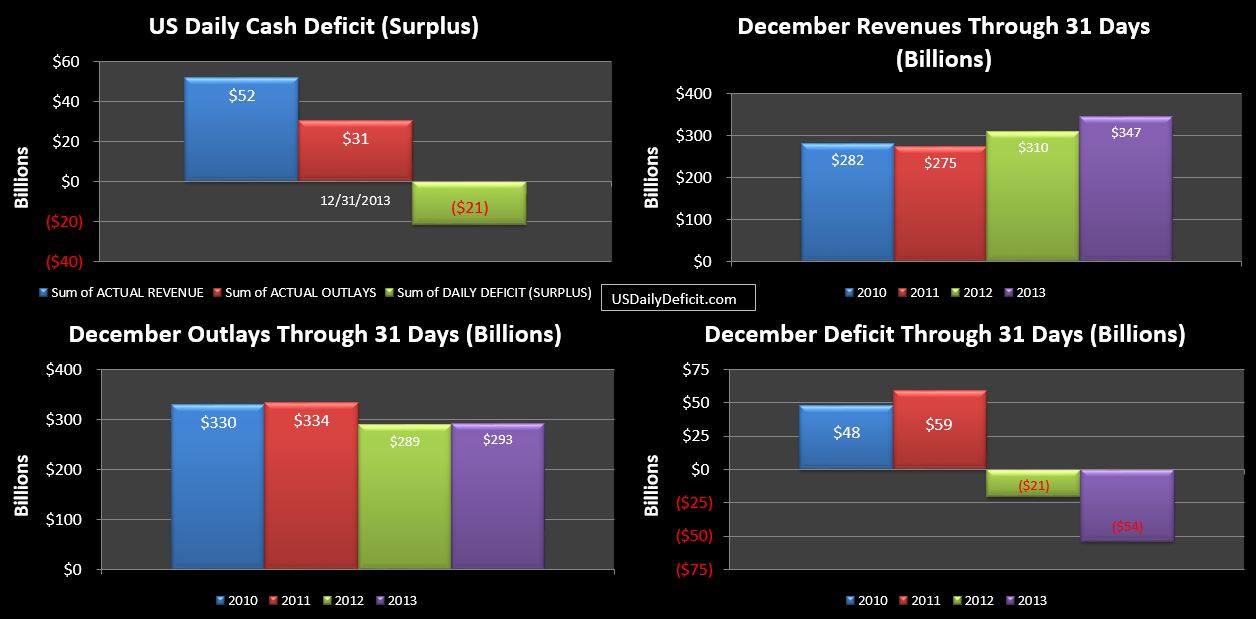
The US Daily Cash Surplus for 12/31/2013 was $21.4B pushing the December 2013 surplus to $54B, and the 2013 full year cash deficit to $660B. As expected, revenues were strong led by $39B of GSE dividends…including the $25B related to Fannie’s pretend tax assets. Outlays were also strong as $6B of interest was due and a slew of payments that typically go out on the first of the month were pulled into December with 1/1 being a holiday…..of course this happens every year, so it doesn’t really cause a timing variance.

12-31-2013 USDD

I’ll have a more detailed 2013 post up in a week or so, but the bottom line is that 2013 was an impressive year, with revenues up 14% and outlays down 1%…good for a $436B improvement from $1.096T in 2012 down to $660B in 2013…the first sub $1T deficit since 2008.


US Daily Cash Deficit 12/30/2013

By | Daily Deficit

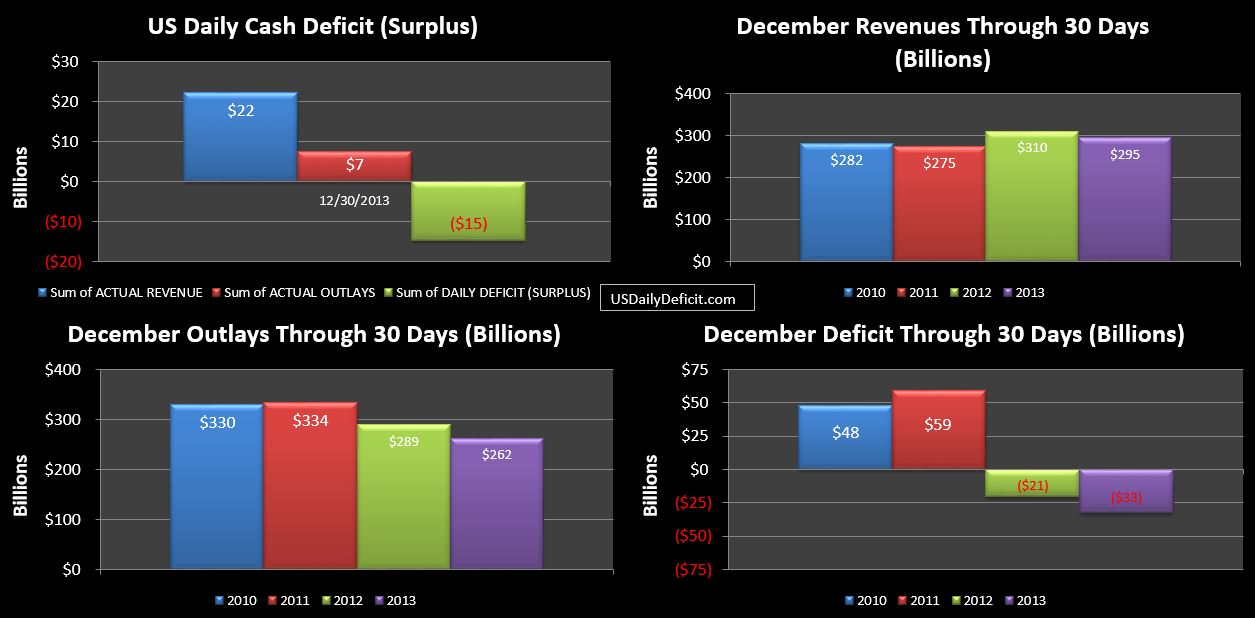
The US Daily Cash Surplus for Monday 12/30/2013 was $14.8B. bringing the December cash surplus through 30 days to $33B.

12-30-2013 USDD

Looking at the chart remember we have synced up 2013 and 2012 on days of the week….we are comparing December 2013 through Monday 12/30 to all of December 2012…which ended on a Monday and has one fewer business day than 2013. The timing scrambles things up a bit, but expect large outlays 12/31 and even larger revenues…pushing both over 2012 levels and pushing the surplus north of $50B. Then…it’s on to 2014!!

US Daily Cash Deficit 12/27/2013

By | Daily Deficit

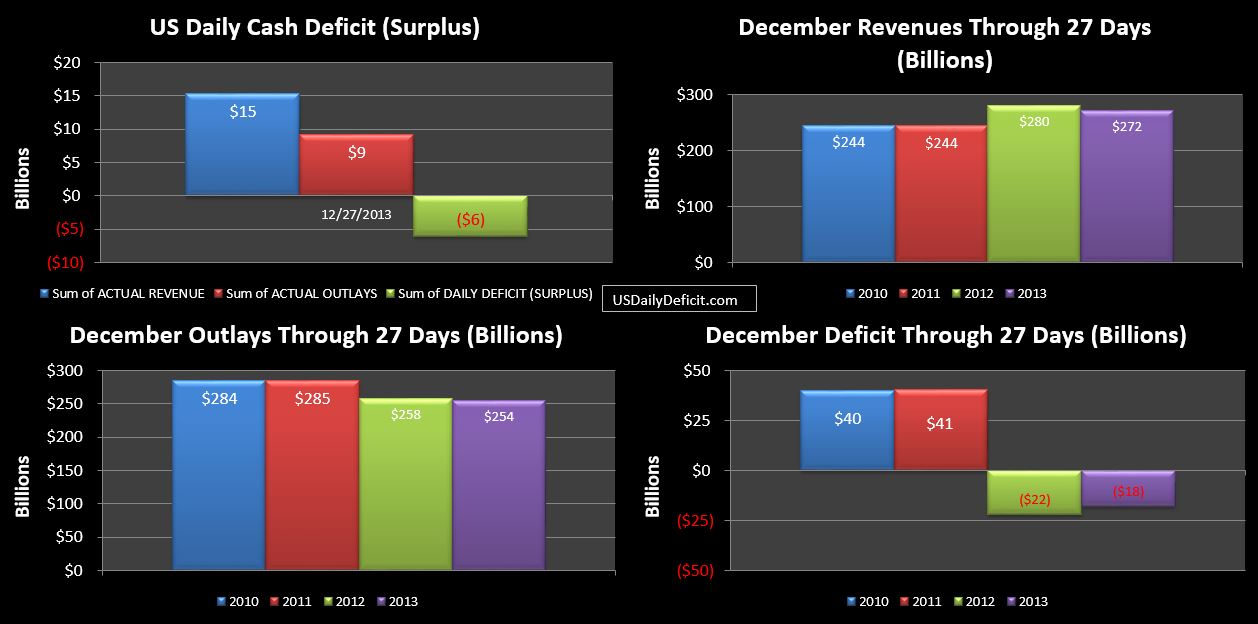
The US Daily Cash Surplus for Friday 11/27/2013 was $6.1B bringing the December 2013 surplus through 27 days to $18B and likely headed to $50B+ once Freddie Mac’s $30B New Year’s present is delivered tomorrow afternoon.

12-27-2013 USDD

Taxes withheld are up 2% YOY, taxes non withheld are up 4%, and corporate taxes are up 4%. Not terrible numbers, but not good enough if your expectation is +10%. Overall revenues are down 3%….a number that will no doubt reverse once the Freddie check clears….which is fine, but don’t expect a repeat next year…or the next…or the next. Between Fannie and Freddie, we are looking at about $75B of phantom 2013 revenues…and that’s just related to the write up of their faux tax assets.

It looks like 2013 cash revenues are likely to come in at around $3.150T…inclusive of the $75B from Fannie/Freddie write up of deferred tax assets. I’m assuming that wad is spent….and will not repeat in 2014. Now…just for revenue to get back to break even for 2014, you need 2.4% across the board growth….which is more or less what the economy is supposedly growing at.  Clearly…anything is possible, and I missed this by about $200B last year, but I’m quite skeptical we get anywhere close to 10% YOY revenue growth in 2014.


US Daily Cash Deficit 12/26/2013

By | Daily Deficit

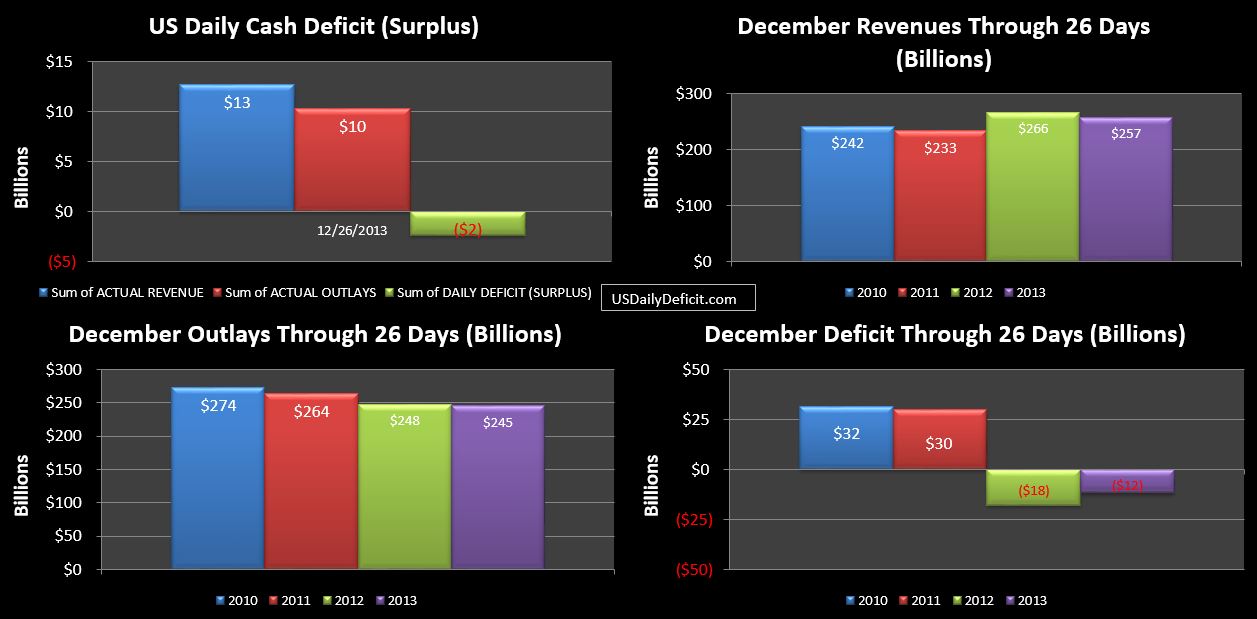
The US Daily Cash Surplus for 12/26/2013 was $2.4B bringing the December 2013 surplus with 3 business days remaining to $12B.
12-26-2013 USDD

No real changes to note….revenues gain a bit of ground and outlays give a little back. This is about the cleanest true YOY comparison we are going to get with the upcoming Freddie Mac “dividend” tainting the true revenue stream. So as of today,with all the SS expenditures done and all of the holidays behind us, we are showing a surplus,  but there’s really nothing to like here with revenues down 3% and outlays down 1%.

Recall…we are starting in a huge hole…$17T+ of debt…and while the digging has slowed a bit from the ~1.6T per year pace in 2009 to the ~$700B we will likely end 2013….$700B is still a huge number. If we ever to balance the budget…..and I’m on record as highly doubtful….we are going to need to string together another 3-5 years of solid revenue gains….just to get to zero. Without a doubt 2013 has been an impressive year…with ~+13% YOY revenue gains and a ~1% decrease in outlays for a $400B+ YOY improvement.

But…if December through 26 days is a sneak peak of what’s to come in 2014 and 10%+ revenue growth is over…we’re  pretty much screwed (but we already knew that right). Now…maybe it’s not….maybe it’s an anomaly….we really won’t know until April-2014. If at that point, revenues are up another8-10% over 2013’s record showing…perhaps some sliver of hope will remain. But if instead we are in the low single digits, you can kiss….those rosy CBO estimates of a $382B 2015 deficit (and the 2023 $985B deficit) goodbye.

There are already signs that the fed is on the cusp of losing control of rates with the 10 year breaking 3%…nearly doubling from a year ago. and the 30 year inching up pretty close to 4%…up over 1% from just earlier this year. That, on top of SS, medicare, Medicaid, and whatever happens with Obamacare….there are huge cost pressures that are likely unstoppable…If we don’t get revenue gains to offset them the deficit blows up… debt continues skyrocketing, and sooner or later rates spike, or people just aren’t willing to lend the crackheads (that would be us) any more cash. And that’s when it gets really interesting. This is likely inevitable….but the unknown is when? Anybody who says they know is a liar…I could envision scenarios where it gets real ugly real fast…..I could also envision scenarios where this juggling act going on far longer than would seem mathematically possible. That’s what makes it interesting, and that’s why I’m still paying attention….
US Daily Cash Deficit 12/24/2013

By | Daily Deficit

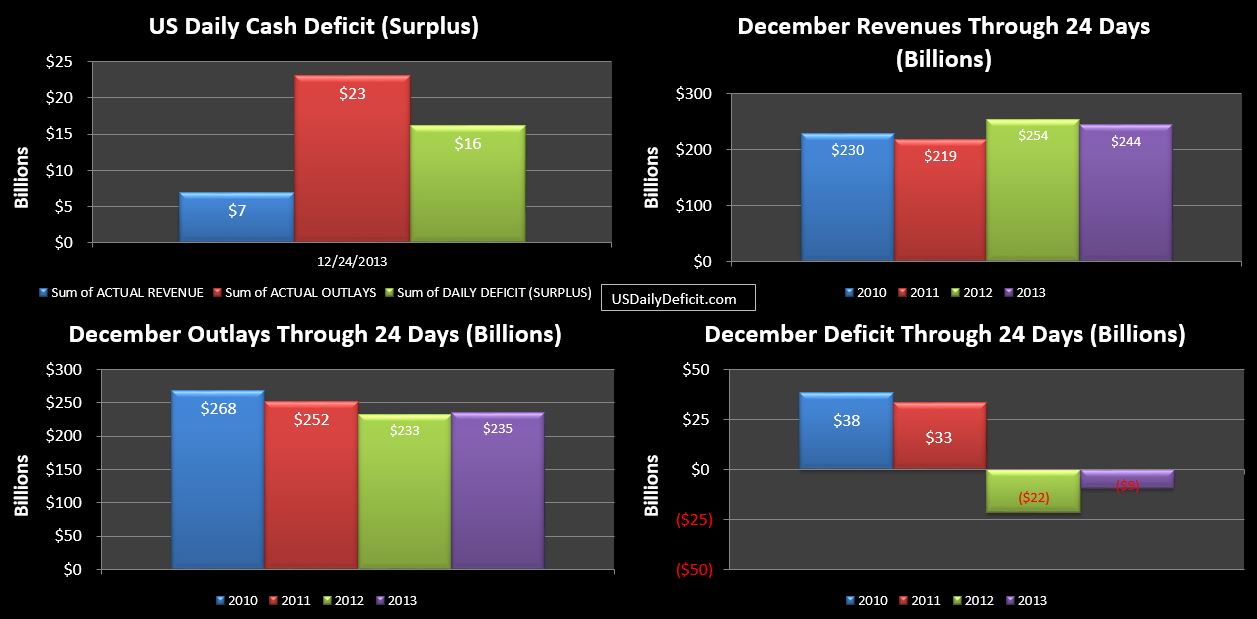
The US Daily Cash Deficit for Tuesday 12/24/2013 was $16.1B driven by the final big payment of SS for the month at $12.7B. This brings the monthly total for SS to $62.6B…about $0.5B over last month’s $62.1B as at least some of the COLA for 2014 kicked in. I had expected about a $1B increase ($62*01.5%), so this is below my expectations….I wonder if it is timing, or just a beat? We’ll probably have to wait for Jan to find out. If it is a beat….just remember that this increases the baseline for the year by a full $6B, which may not sound like much, but in perpetuity…plus a growing base….it adds up quickly. Combined, SS is growing at about $58B per year annualized. Compare that to the latest budget deal, which supposedly saves $23B….over 10 years….hardly even a rounding error. Our TTM cash spend on SS is currently at $733B. At this pace…assuming moderate 5%-6% growth, we would hit $1T in less than 5 years…November 2018.

12-24-2013 USDD

To the charts…we have some Christmas related timing issues, but same old story…revenues are still down, though cost has come up a bit….it will be interesting to see if that is timing or if it actually sticks. We are still at a surplus for the month and are almost certain to stay there thanks to about $35-$40B of cash that should come in 12/31 thanks to our good buddies at Fannie/Freddie and their Enron accounting principles…hey it’s cash…we’ll take it right??