Category

Commentary

June 2014 Update: Social Security Enrollment

By | Commentary

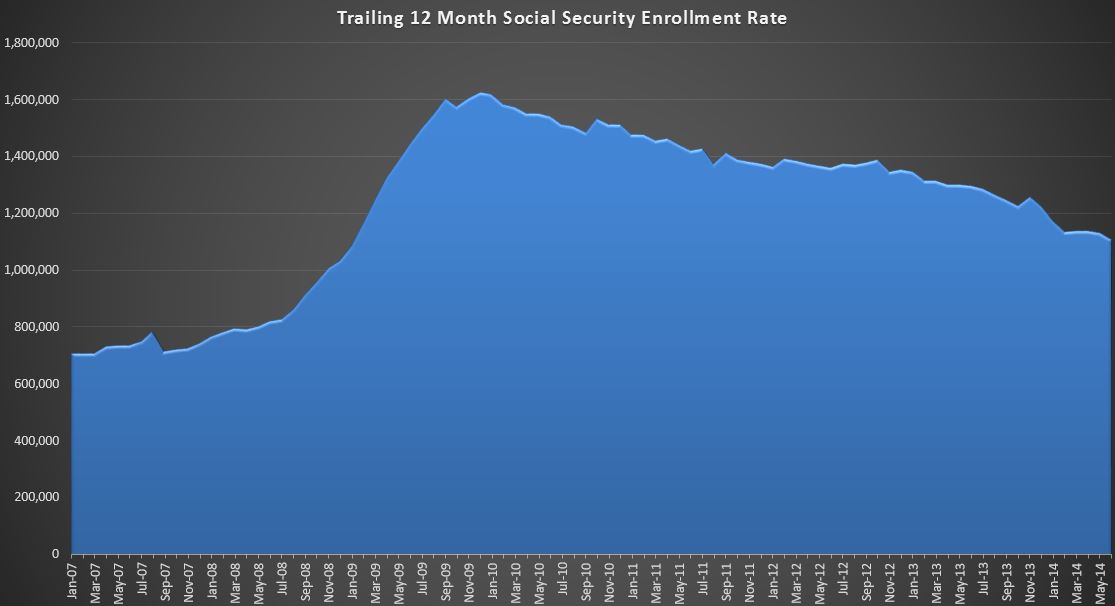
The June 2014 numbers are in and show an 11k drop in SS rolls….from 58.586M at the end of May to 58.575M at the end of June. This represents the first drop in nearly 4 years, but it isn’t a huge surprise. The truth is, June and July are seasonally weak months. I don’t exactly know why, but most of the change seems to be the categories related to minors…maybe graduating seniors get dumped off the rolls each summer?? Reductions in minors offset a 75k increase in retired workers pulling the overall population down. Last June and July came in at +13k and +3k respectively, so while a reduction in the rolls is certainly a good thing….it represents a 24k reduction in the annual rate of gain….that rate still stands at 1.106M.

2014-07-10 June SS Analysis

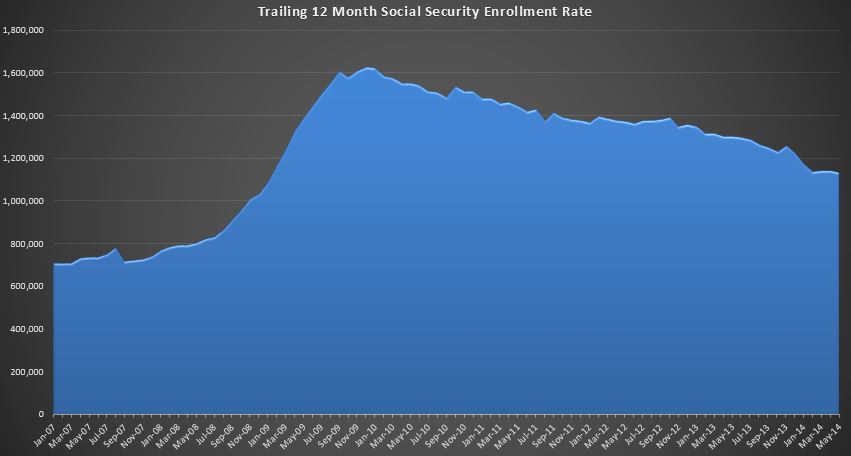
Perhaps the chart can add a little perspective. It’s certainly not bad news though. The 4 month plateau we were discussing last month looks like it is giving way to a continued reduction in the annual rate. There is a good chance we will see further reductions next month, followed by an uptick leading into the fall.

All in all…I don’t see any dire warnings in this data indicating a 2008/2009 spike is on the way….so Party On!!….for now.
May 2014 Update: Social Security Enrollment

By | Commentary

The May 2014 numbers are in and we added 114k people to the SS rolls compared to 124k in May 2013.The total consolidated enrollment now stands at 58.589M…good for 18.41% of the population receiving an average of $1187 per month.2014-06-28 May SS Analysis

We can see what appears to be stabilization for four months now just a bit over a 1.1M annual rate of increase. I keep an eye on this series to catch a material change in the enrollment trend….in particular the beginning of another spike like we saw in 2008-2010. Clearly…we don’t see that this month. In fact, it’s not even clear that the stabilization is a trend…yet.

As of May 2014…the rate of change in SS EFT cash outlays was +$50B annualized. This is down from a peak of $65B in Dec 2012, but it’s still a big number….requiring $50B of new revenues each year just to keep the deficit even. That hasn’t been a problem in the last year…with revenues gaining at a $300B+ rate, but this is unlikely to be the case forever.

April 2014 Update: Social Security Enrollment

By | Commentary

The April 2014 SS numbers are in and we added 130,874 people to the consolidated headcount just barely edging last years 130,724 add by 150 people. The total consolidated enrollment now stands at 58.472M…good for 18.38% of the population.

2014-05-20 April SS Analysis

So in the big picture, we are still plodding along at an annualized rate adding about 1.1M people a year….pencil that out assuming new benefits at a rate of $1500/month, that’s about $20B per year…a big chunk of the programs ~50B growth rate….with the rest being primarily the COLA adjustments which are small, but being applied to a huge base.. At that rate, assuming everything else in the entire budget is frozen…we need about 1.6% annual growth in revenues just to stay even….or about what we just saw in April.

But the real reason I watch this series is because I am watching for a material change in the enrollment trend. Clearly we don’t have that this month. What we do have is two months of essentially no YOY change against over a 4 year trend of moderate decline. Two months in a row isn’t particularly alarming, but a few more would definitely be interesting.

March 2014 Update: Social Security Enrollment

By | Commentary

In March 2014 the SS rolls added 143k to the headcount bringing the total to 58.341M. This compares to a 138k add last March, breaking a 4 month string of improvement.

2014-04-14 March SS Analysis

It’s just a one month break in a downward trend dating back to the last peak in December 2009 at 1.6M, so it’s nothing to get excited about either way. The rolls are growing by over 1.1M people per year, and cash outlays are growing at 8% annually, which is a combination of additional people, COLA adjustments, and new retirees coming into the system with higher monthly payments than the people they are replacing.

As I’ve explained before, I monitor this series primarily to look for signs of a new spike similar to what we saw between 2008 and 2009. If this correlated with a decrease in revenues, we would have a pretty clear sign that a recession is either already in progress or imminent. As it stands, we see neither. Revenue is at all time highs and growing at about 12% through the first 100 days of 2014. Retirements…while still high historically, continue to trend down….slowly. It’s clearly too soon to declare that everything is going to be ok, but even I must admit….things have been a lot worse.

February 2014 Update: Social Security Enrollment

By | Commentary

In February, the SS rolls added 120k people….up from January’s 103k, but down from February 2013’s 159k add. February is typically the largest add of the year, so no real surprises here.

2014-03-20 February SS Analysis

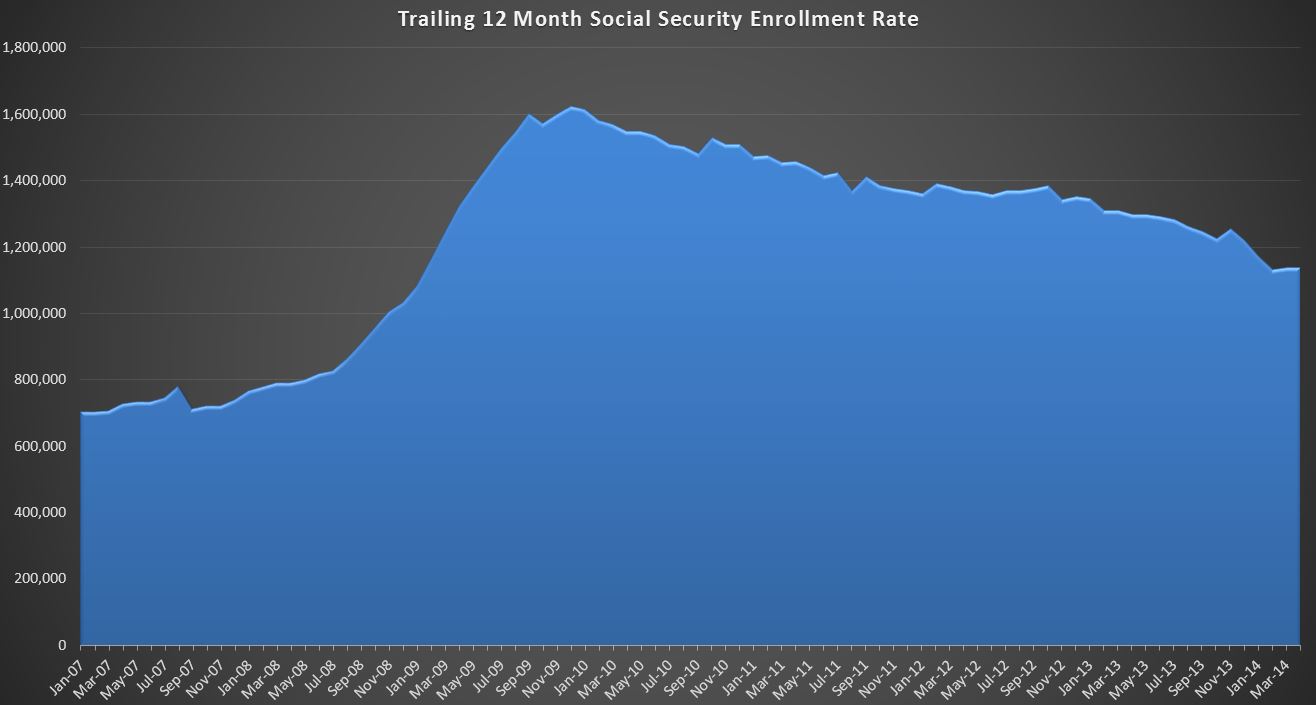
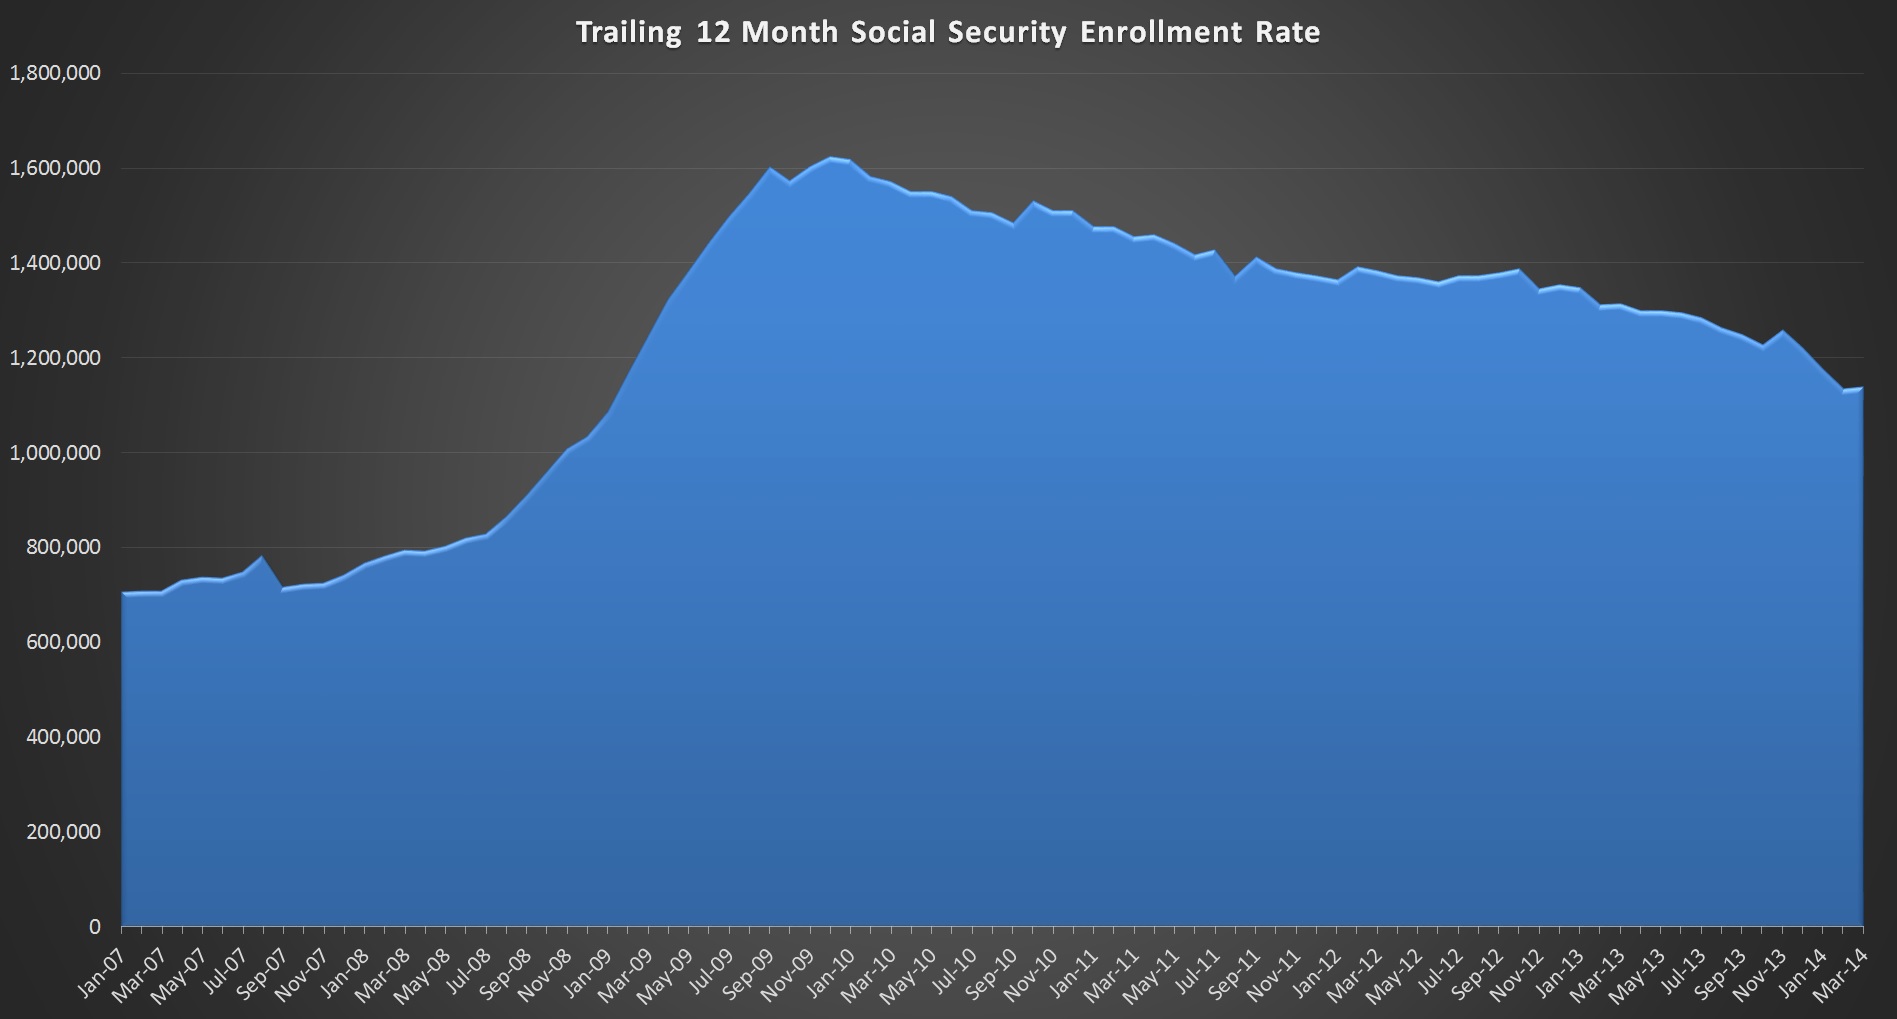
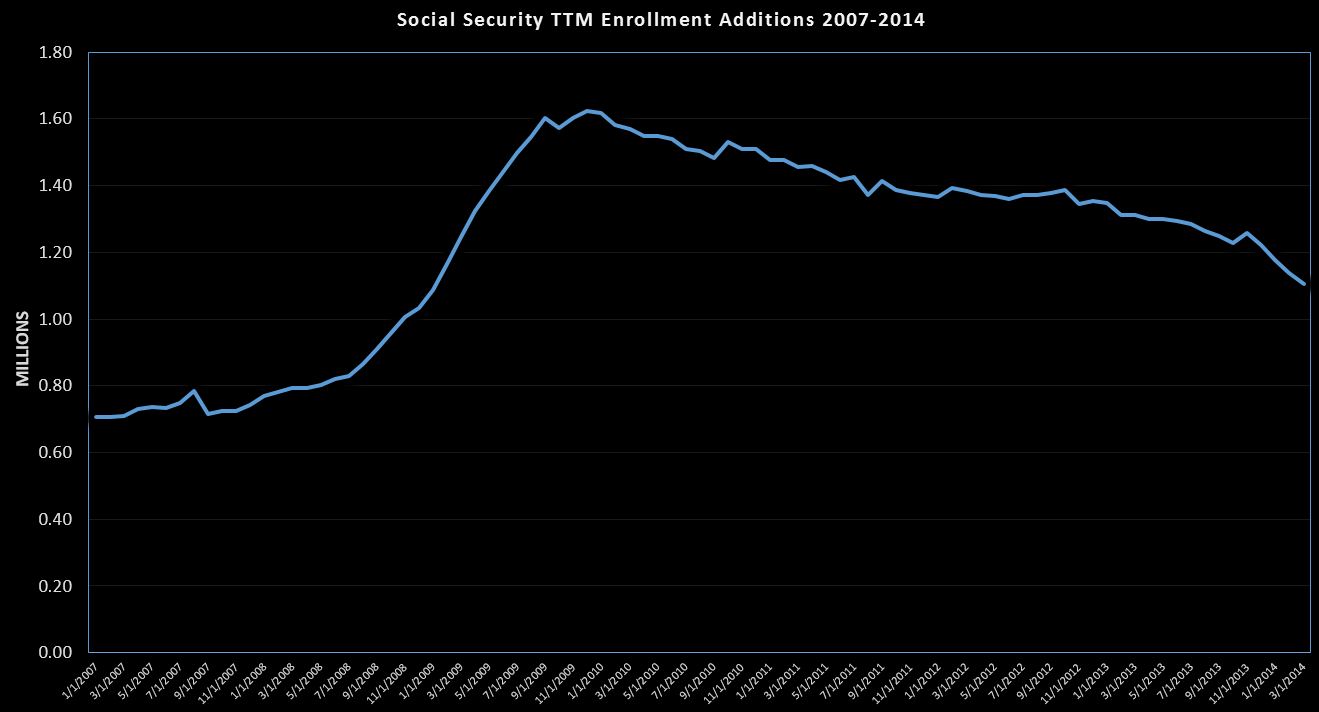
The above chart shows the TTM change starting in 2007 with an annual rate of about 700k, spiking to 1.6M in 2009, and trending down since. We are still well above 1M at 1.138M, but we have 4 months of decline…note that this is just a decline in annual additions…we are still adding at a historically high rate, just not as high as the peak of the recession. That said, the 4 month trend does look steeper than anything we’ve seen since the peak. Perhaps Boomers close to retirement are deciding to stay in the labor force a bit longer….holding the rate down for now, and ultimately increasing their payouts.

Looking to the cash outlays on the DTS, YOY growth comparing this trailing twelve months to the prior shows about an 8% growth which is made up by growth in population, COLA increases, and by an increase in average payouts….driven by new enrollees having higher monthly payouts than the existing population….for example in a given month an 85 year old recipient with an $800 monthly payment passes away and a 66 year old recipient files for the first time with a $1500 per month payment…..population stays the same, average payout goes up.

The primary reason I monitor this is to spot the early stages of a new recession driven spike in enrollment…. If anything we see exactly the opposite, which is the same sign we are getting from surging tax revenues for going on 2 years straight. Very curious….