Category

Commentary

Debt Limit Recap Summer 2013

By | Commentary

It’s been 62 days since we officially hit the debt limit of $16.7B on 5/17/2013, and according to the latest I’ve been reading, Treasury does not expect this to become a problem until the September-November time frame. This is a bit confusing, so give me a second to explain what is going on here.

First…you need to know that hitting the debt limit is not the real problem….running out of cash is. If we hit the debt ceiling, but had $1T of cash in the bank, we could make it an entire year without having any problems. Obviously, we did not hit the debt limit with $1T of cash…we hit it with about $34B, but the point remains valid….we haven’t had any problems yet because we haven’t run out of cash.

Now, assuming an annual deficit of $800B, you might expect a monthly deficit of $67B…at which pace we would have run out of cash sometime in early June. Except…it’s not that simple. You see, the month to month deficit/surplus is actually all over the place, with February usually having the highest deficit at $200b+ and April typically running a strong surplus of $100B+. The rest of the months fall somewhere in between, with quarter end months generally being better on strong quarterly tax remittances.

So the time it takes for the debt limit to be a problem depends on how much cash you have in hand at that point, and the expected deficit/surplus over the coming months. The last debt limit fight…you may recall came about in January…which is the absolute worst time to have a debt limit fight because a huge amount of tax refunds are scheduled to go out starting in February. If they don’t go out…you could have a revolution on your hands, so not surprisingly, a deal was brokered, pushing the fight out to the middle of May, which as it turns out, is just about the best time to have a debt limit fight…if you must.

The main reason is that you have the strong early month outflows behind you, and with June in front of you likely to run a surplus, you have at least a few months to work it out. This June ran a $116B cash surplus….building that $34B cash stash to $135B by June 30…thanks in part to a ~$60B payday loan to Fannie Mae. Now, July and August are not deficit friendly months…I expect about $200B over this two month period. That’s more than $135B, but…thanks to the shenanigans known as “extraordinary measures”…which essentially hides real debt off the balance sheet…it seems likely that treasury can pull the difference out of its hat… September is likely another Surplus month, but small….so making it to September gets them through to early October. I don’t see how they make it much further, but you never know.

Now honestly, the date doesn’t matter….it took us 30 years to get to this point…whether we run out of cash in August or November really doesn’t matter one bit in the big picture. I fully expect the debt limit will be raised and here is why. Even with admittedly material improvement in the deficit…from $1.6T in 2009, to $600-$700B likely for calendar 2013…$700B is still a huge number. And if they don’t raise the limit…they can’t spend it. I’m not saying it’s the right thing to do, but yanking that $700B per year out of the economy is going have immediate consequences that nobody in either party is ready to deal with.

Basically, it would mean cutting everything by about 20%. Social Security, military pay, medicare, Medicaid, food stamps ect…. If you don’t cut some…like SS and military pay….you have to cut even more from the remaining programs. $700B/60k per person gives me over 10M jobs lost directly, and who knows what the secondary and tertiary effects would be. Now…one way or another, that’s going to happen anyway (and we will be better in the long run for it), but don’t expect the debt limit to be the trigger. Both Republicans and Democrats will work together to keep the imaginary party floating as long as possible before gravity takes over and we all tumble down the cliff together.

Because  of this, I am quite confident that after a lot of noise and pretend victory claimed by both sides, the debt limit will be raised. Don’t worry…Be Happy!!
Immigration Reform To Reduce Deficit By $1Trillion?? Uhmmm….Bull#@!%

By | Commentary

I finally got a chance yesterday to watch Sunday’s “Meet The Press”…the one political show I try to watch each week. Obviously, there were bigger news stories, but in the interview with Harry Reid, he mentioned several times that the Senate Immigration Bill would reduce the deficit by $1T dollars….”go read the CBO report” he said. So I did.

Conclusion….it’s all complete BS. For starters…the “savings” predicted over 2014-2023 is $197B…$1.6B per month. Basically, a rounding error. So…where is the rest of the savings…you ask? Well, they predict an additional savings of $700B over the 2024-2033 time period. I thought it was ridiculous when our politicians started trotting out 10 year savings instead of annual numbers…now they are trotting out 20 year predicted savings? Why not 50 year…or 100 year estimates just to make the numbers look bigger in print?

Look…the truth is, nobody, not the CBO, not myself…not anybody can make an accurate prediction for 10+ years. Not for something as cut and dry as social security outlays, and certainly not for the amount of deficit savings for a proposed immigration bill. What they did here…almost certainly at Reid’s request…was to assume that the immigration bill increases the population over the base case, thus increasing GDP, and I suppose tax revenues. They go on to change their estimates about future wages, productivity, capital investment ect….I could go on, but the bottom line is, it’s all bogus. Harry Reid walked over to the CBO….handed them a list of ridiculous assumptions to process, and they popped out exactly what he wanted…a ~$1T deficit reduction over the next 20 years. Of course we know it will be completely wrong, and Harry will be long retired before he has to deal with the consequences.

I honestly could care less what happens with immigration reform, but I do think that this provides a very good illustration of why we are completely and utterly screwed in the long run. There is no honesty left in our government. Whether it is proposed legislation or policies, each side shows up with their own “experts”….each of whom are free to lie their asses off. The public then is left to decide not what is the correct or optimum path….but which side was the best liar. So…here we are…20 years later. At 18…we graduated valedictorian of our class…ready to head out to change the world and make our fortune. This morning, after years countless bad decisions….we woke up in a ditch…sick, penniless, homeless…looking for our next fix….lamenting about what could have been. Until we get a shred of honesty from our “leaders” from both major parties….there is no hope….we will continue down our dark path…making bad decision after bad decision. Such a waste…we are so much better than this….yet here we are. It’s just sad really. I grew up in the greatest nation the world had ever seen. My kids won’t.

Interest Rates On Government Debt: Low And Headed…Lower??

By | Commentary

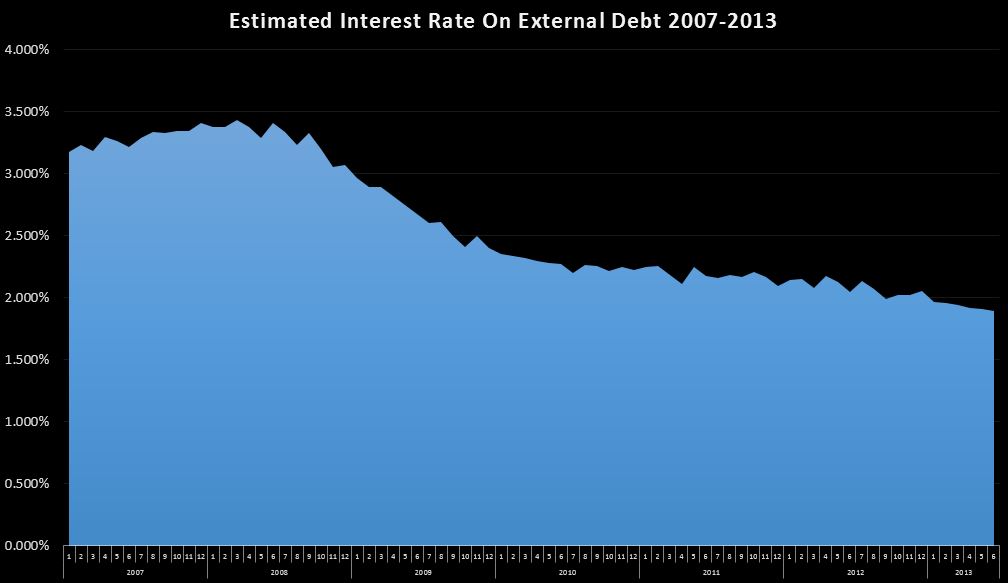
Over the last 12 months, about $220B of cash interest payments have been made on a rough average of 11.6T of external debt(Average of last 12 month ending balances)…for an estimated rate of 1.895%…not too shabby for unsecured debt.

07-15-2013 estimated interest 2007-2013

1.895% is the low point in my data series…going all the way back to 2002, and is almost certainly the lowest ever. I’ve mentioned before that this is one of the key metrics I keep an eye on because the only way we as a nation have managed to get this far is the extremely low rates. It is my hypothesis that this is the real reason the Fed has been manipulating rates so low for so long…if they ever go up…the long term deficit goes kaboom. There has been a lot of talk lately about rates going up, in fact I looked at it just a few weeks ago in Interest Rates Rising – What Does It Mean For The Deficit??

In that article, I came to the conclusion that the recent increase in rates, while not a good thing (for the deficit) it was unlikely to have any short term material impact on the deficit. A few days ago, I stumbled upon Treasuries Monthly Statement OF Public Debt (MSPD) which gives us a breakdown of the debt outstanding…by each issuance. This gave me the data I needed to take an even closer look at the internal mechanics of our debt and cash interest expenses.

So let’s first envision a scenario where the national debt is $11.6T, but that it is stable. That debt is made up of hundreds of different issues…each for a unique term, set by the market rates at the time they were issued. For all of these together, we know that the weighted average is about 1.895% at present. So as we chug along in our steady state…each month, old issues come due, so they are paid, and replaced by new issues…at current rates. If the expiring debt is a higher rate than the current rate…the weighted average will continue to decline over time.

The MSPD data set gives us the ability to see what debt is expiring, and this gives us some insight into the direction of rates…at least in the short run. So let’s look at the data. It just so happens that 3 years ago, on 7/15/2010, Treasury issued about $35B of 3 year notes at 1%. Those notes were paid yesterday. So I went over to yahoo, and it looks like the 3 year’s going rate is about 0.6% today…so theoretically…Treasury could have essentially refinanced that $35B…at nearly  half the rate. The savings are about $1.4B per year.

Another example is the 30 year bonds issued in Feb of 1985…$10.5B at 11.25%. I don’t know what rates will be in a year and a half, but there is a pretty good chance it’s way under 11.25%. If it’s not….you’ll have bigger concerns.  Obviously…this refi will lower the weighted average rate…even if it comes in higher than the 1.895%.

Just glancing at the next 12 months of expiring notes (2-10 years)…there is about $1.3T, and the vast majority of it is at higher rates than it could be rolled at today’s rates. So, while rates seem to have come up a bit off of some extremely low lows….rates are still lower than they have been historically, and this will continue to push the effective rate down…probably for at least a few more years. Rates are still extraordinarily low, and for the sake of the deficit, I expect the fed to keep them here until they no longer can. Even then… given the massive amount of debt outstanding, it will take a few years of rolling from lower rates to higher rates before we start to see material increases in interest expense. All of this of course assumes they can roll debt at any rate…which maybe a bad assumption….I know I wouldn’t loan Uncle Sam any money, but that’s just me:)

So for the time being, I fully expect the effective interest rates to continue a modest decline, roughly keeping interest paid the same, despite debt continuing to grow (at least after the debt limit hike is passed…which it will be) While interest is definitely going to be a huge problem over the long run when the fed loses control of rates and we have to start paying market on ~20T or so of unsecured debt….in the short term, it’s going to take a lot larger swing in rates than we have seen to date to make a material impact on the budget deficit.

7/12/2013 Daily US Cash Deficit

By | Commentary

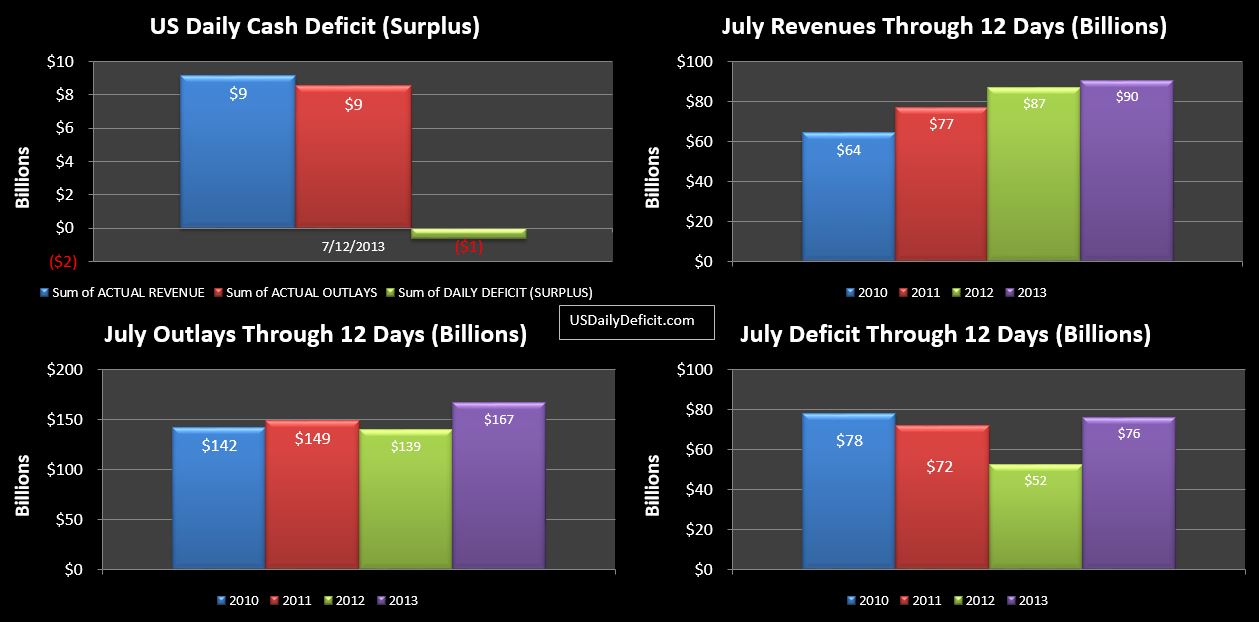
The US Daily Cash Surplus for 7/12/2013 was $0.7B bringing the July 2013 deficit through 12 days to $76B. Revenues are still showing some weakness…at 4% YOY growth, but there is a good chance that improves a bit this week as corporate taxes start flowing in. Furthermore, the extra day over 2012 should give July 2013 a ~5% bump at the end…at August’s expense.

07-12-2013 USDD


Do Federal Employees Pay Taxes? Kinda, But Not Really

By | Commentary, Quantum Economics

One of the first challenges I faced when I decided to use the treasury department’s “Daily Treasury Statement” was to reconcile the thing to other external data points like the debt outstanding and cash balances as well as internally reconciling the tables within it to make sure I understood the report inside and out, and furthermore, trusted it. In this quest I ended up stumbling on one thing I could not answer…the “Cash FTD(federal tax deposits)” category in table II…which makes up over 2/3 of all cash deposits never tied to table IV, which summarizes tax deposits by type, like withheld income, corporate taxes ect… It was perpetually short by a category labeled “Inter-Agency Transfers”

It took some back and forth, but the good folks at Treasury provided the clues I needed. This imbalance..$82B over FY 2012 is due primarily to the affect of FICA taxes and Income taxes withheld from the paychecks of federal employees.

Before we look at that, lets start by looking at a regular employee of a fortune 500 company. Say the person has an annual salary of $100k, $25k of which is withheld from the paycheck and submitted to the federal government by the company. This $25k (plus another $7650 for FICA) shows up on the DTS as cash received in the “CASH FTD” category.

Now….let’s use the same example, but this time the employee works for the federal government. Each year…the government sends the employee his $75k of cash….but what to do with the $25k of taxes withheld? Transfering $ from one bank account to another has no net affect on cash in this scenario…unlike when it was submitted by the fortune 500 company. The plug is “Inter-Agency Transfer…essentially an intercompany elimination. This is why we have the $82 difference. That $25k of taxes “paid” by the employee show up in the official tax receipts number…even though no marginal cash is ever received…it just gets shuttled around from one federal bank account to the next…netting out to zero. 82B per year!!

Looking at this from another angle…say the federal government has revenues of exactly $1T, and the economy is perfectly stable…no change in employment, no raises ect…everything is constant. Then, the government decides to hire our employee for $100k per year. When all is said and done…government revenues have stayed exactly the same, even though income is up $100k, and reported income taxes are up $25k. Contrast that to if the employee was hired by a company…then government revenues would have increased by $25k+. Isn’t that something? The federal government could go out and hire 5M people….and it would have exactly no direct increase in cash inflows. Or…you could fire all of the current employees…and cash inflows would not drop a penny.

So what is going on here? Essentially, the cost associated with federal employees income and payroll taxes, and the revenue they represent, net to zero. The affect is…that the federal government can essentially hire identical employees, yet effectively pay quite a bit less than a company would bringing up an interesting point….that in the end, consumers pay all taxes. In order to get $75k of cash to the employee, a company has to pay $100k because Uncle Sam want’s his “rent”….as if he owned you. That cost…is pushed all the way through the value chain and ultimately ends up on the retail shelf, raising the cost of everything…probably by a factor of nearly 2 when all is said and done. Ponder on that for a while….you can raise taxes on whoever or whatever you want in the short run, but in the long run, the economy re-adjusts back to equilibrium…with higher prices for everything as the plug.

So…to answer our question…while government employees end up with the same after tax pay as a corporate employee with similar gross pay does, their income taxes more or less manifest themselves as a discount to the federal government rather than cash receipts or actual revenues. I think that the reality is…not only do Federal employees not pay income/payroll taxes…none of us as individuals do. Instead…our employers essentially pay a consumption tax on our labor pushing the cost of a $75k per year employee up over $100k.  If there were no income/payroll taxes, our employee’s take home salary would still be around $75k…but it would go a lot further because the price of everything would be 25-50% lower. Instead….consumers simply pay more. Our employer pays over $100k for a $75k employee just like at the grocery store, you pay $2, for a $1 loaf of bread.