So…I didn’t pick a great time to go AWOL….it’s a bit premature but the deficit picture seems to be getting worse by the week since May.
recall…April was a really good month with revenues up $65B and +14% YOY…a home run by any stretch, but my question back the was…Is this the last hurrah? My theory was simple…2017’s pre tax cut taxes came due April 15th…come May we would be seeing our first “clean” view of the tax cuts.
May came in worse than expected with revenue down $35B good for a 13% decline. Outlays were up about 3%, and combined with the revenue miss, the deficit for May was $49B higher than last year. Ok…one month does not make a trend…there are all kinds of ways a single month can get thrown out of whack with prior years.
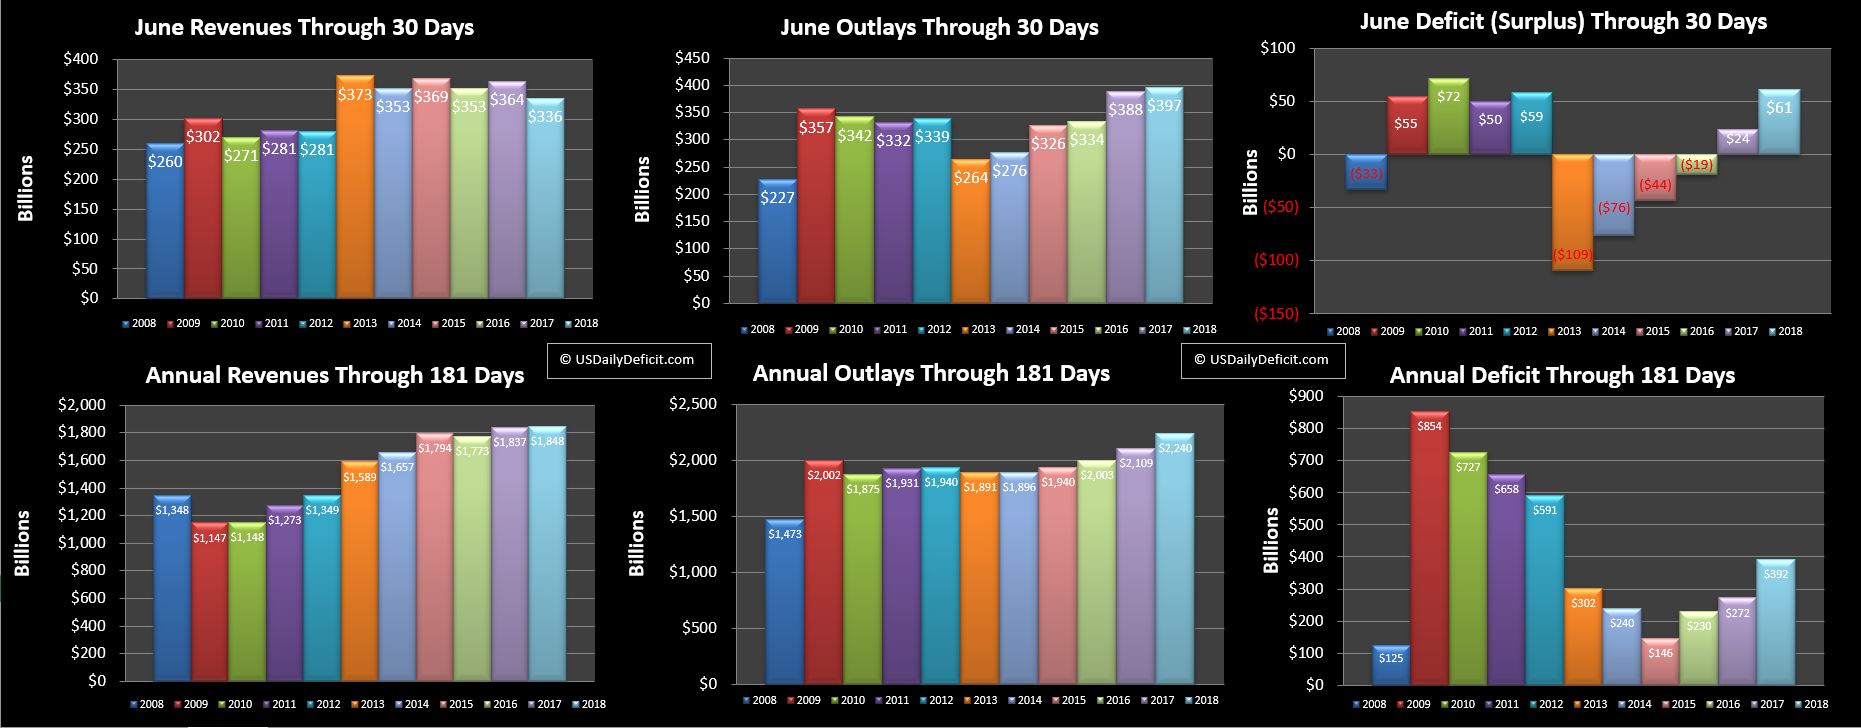
Enter June:
 Revenues down another $28B, an 8% decline with outlays up 2%, leading to a $64B deficit compared to last June’ s $24B.
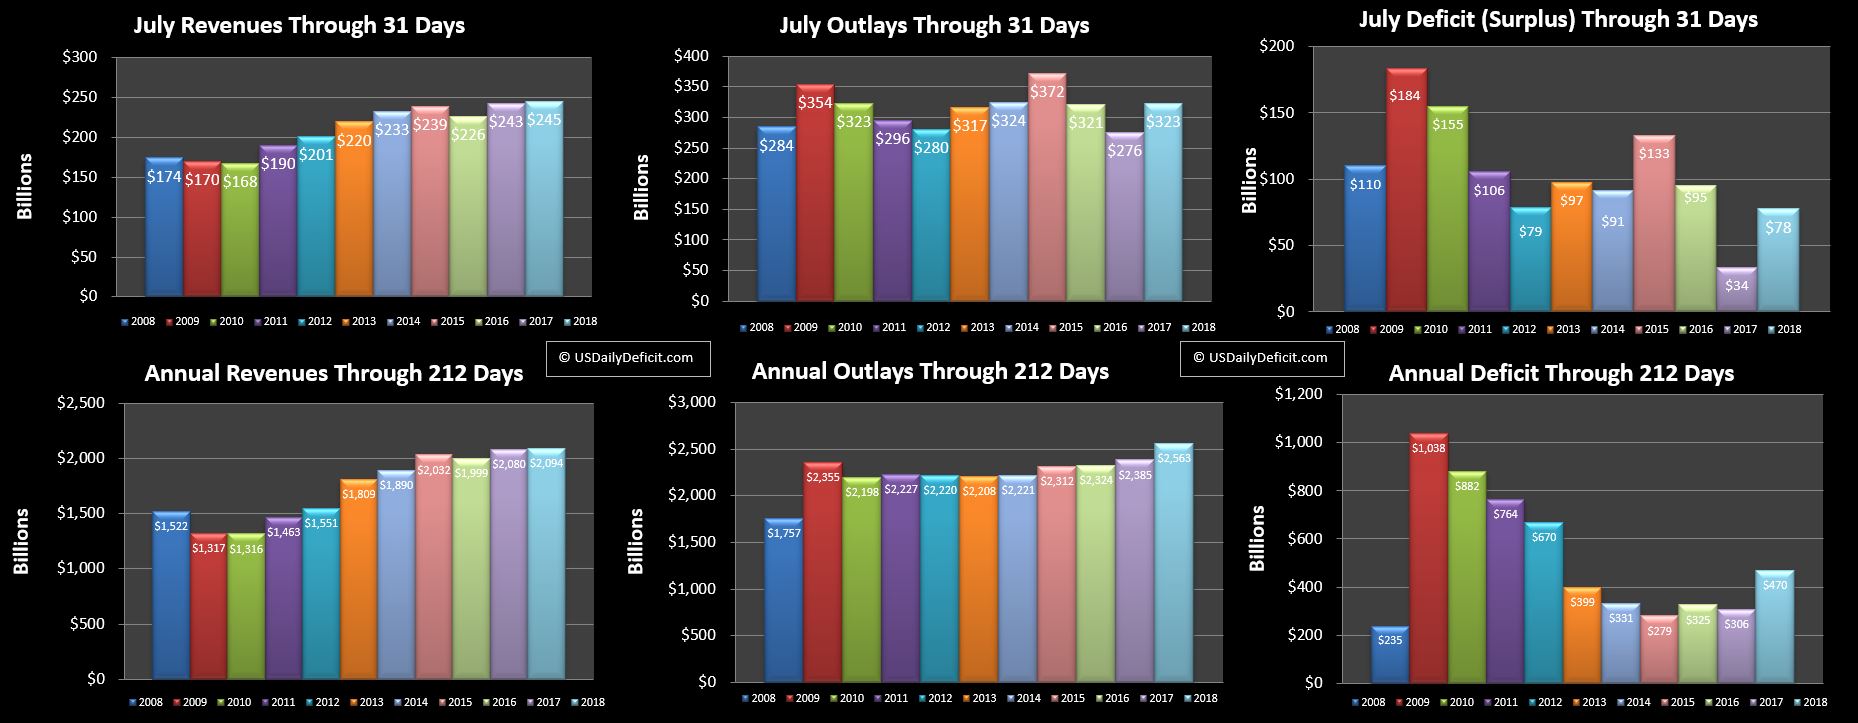
Then July:
Revenues weren’t as disappointing…they were actually up $2B, but outlays were up $47B on some month end timing, putting the deficit up $44B (they don’t tie because of rounding).
So…my idea is simple…what if instead of looking at a fiscal year (Oct-Sep) or a calender year (Jan-Dec)…maybe we should instead be looking at May-April. It’s not perfect, but at least this year with tax changes…it may provide a little bit better picture of the YOY. So here goes:
Without digging in too deep… for the last three months, revenues are down 7% and outlays up 7%….and the deficit is up 80% from $166B last year to $296B.
Holy smokes!! That’s bad…maybe not as bad as it looks thanks to some timing issues in there, but it’s pretty bad. I don’t think those numbers stick for the next 9 months, but revenue down 5%, outlays up 5% sounds like a decent guess…September should provide some clarification. Now yeah, it’s kind of a one time event…all else equal next May we should see revenues get back to their ~2-3% growth, but by that time we should be well over $1T annual burn rate.
This isn’t my official forecast…but just to throw some ballpark numbers at you…Calendar 2017 ran about a $700B deficit, Calendar 2018 is looking like it will be around $900B, and 2019 could easily make a run for $1.1T. Throw in a recession anywhere any time and it’s not hard to see how we could jump to $2T virtually overnight.
Death Spiral Accelerating?
I’ve been following the deficit for about a decade and a half and blogging about it here since 2012, and a few years back it became clear to me that however slim the odds ever were….the window to avoid default had been passed and default was now inevitable….now it’s just a matter of watching for signs of a collapse.
Now timing…I have no idea…if you had asked me 10 years ago, I never would have dreamed we would make it this far…yet here we are…alive and well for the most part. In retrospect…perhaps the most critical enabler of this massive debt load was low interest rates. For close to a decade, rates were near zero, so as old debt expired, it was refinancedat super low rates….including the 30 which bottomed out at just 2.25%. Now…what kind of moron would loan Uncle Sam money for 30 years at 2.25%? Not this guy :)….but someone has it on their books.
And then…interest rates started rising. They still aren’t high….but every month now old debt is expiring and being refinanced at higher rates than a few years ago. Short term debt…once practically 0% is getting close to 2%, and longer term debt is edging past 3%. Still low historically, but when you are adding debt at $1T per year and refinancing Trillions more….each fraction of a % means just a little more debt on the camels back…day by day, month by month, year by year. We already know it is impossible to repay….now we are just looking for signs that the fuse has been lit.
Stay tuned….it’s starting to get smokey in here…

