All Posts By

copernicus

Fun With Math – Marginal Cost Of Hiring Minimum Wage Employee

By | Commentary

I’ve been seeing a lot of Obamacare Articles, and even some on the minimum wage, so I thought I would crunch the numbers and see what the fuss is all about.

In Texas, the minimum wage is 7.25 an hour, which pencils out to $15k per year, or $1250 per month. Let’s ignore FICA, unemployment insurance, workers comp, and burdensome administrative costs and go straight to the elephant in the room….healthcare.

Say I have two equally qualified candidates…one a healthy 25 year old non smoking male. The other, 45 year old smoker, with 4 children and a pregnant wife…high risk of course.

The cost of insurance for the 25 year old may be $5000, but there is a good chance actual costs will be zero. Personally, I made it through my 20’s with a single Dr. visit…for stitches, and I paid the full $600 because my deductible was like $2k. On the other hand, a family plan is probably going to run 25k, and actual costs…given the high risk pregnancy and smoking could easily run 100k…or much higher.

What should our business owner do? All he wants is a minimum wage employee to sweep the shop and mow the grass. He’s ready and willing to pay $15k…maybe even 20k. But $40k…no way!! Unfortunately, due to the laws and regulations…our business owner is not allowed to ask, or use the employees health as a factor in his hiring decision, despite the fact that different employees can have a huge difference in cost. This is a huge problem nobody is talking about. Companies, especially smaller ones, need to be able to forecast with precision how much it is going to cost to add headcount, and with the current setup, medical costs to the employer are completely unpredictable. In my opinion, this is one (of many) reasons unemployment/underemployment is as high as it is.

Let’s look at it from another perspective. So, imagine you are at the car dealership…trying to decide between the red minivan and the blue minivan. The cost is the same…$30k. You ultimately decide on the blue one, and walk up the checkout line…where the salesperson rings it up. That will be $60k. Say what?? Well….it turns out that this minivan was built on an assembly line by high risk/unhealthy workers. So while the sticker is $30k just like the red one (built by only young and healthy employees) but there is a $30k surcharge.

Wait just a minute you say….I changed my mind. I want the red one for $30k…or maybe I no longer need a minivan. “See…the thing is” the salesman replies….”if you try to change your mind now….the unhealthy employees and the federal government are going to sue your ass to the moon.”

As a buyer of consumer goods….you can realize the absurdity of this scenario, but this is in fact businesses…as consumers of labor must deal with on a regular basis. Is it any wonder employer’s are hesitant to hire? They have no idea what an employee is going to cost them until after they make an offer, and especially with low wage employees, the cost of insurance could easily be more than the wages they are offering. No thanks!! So…they stick with contractors and part time workers. Everybody ends up losing, most of all the employee who now can’t find a job period. Thanks Uncle Sam….those darn unintended consequences….when will he learn?

Now…back to our example, assume that the businessman instead ends up hiring both guys. They have the same skills, and perform the exact same task, but the healthy, unmarried employee has a total compensation package of $20k…$15k wages and $5k of healthcare. Our second employee makes twice that….$15k of wages, and an additional $25k for healthcare. Blatant discrimination right? Nope…just the status quo….an involuntary transfer of wealth from the young and healthy to the old and sick.

The solution is simple….employment and healthcare must be severed completely, and individuals must take personal responsibility for their own healthcare needs. Were this done…the businessman in our example above could offer a wage of $25k to both of his new employees with no health benefits. Each employee could then go purchase whatever health care plan…or no plan that best met their needs. Furthermore…they would need to accept responsibility for their own decisions. If they decide to smoke…and then need $250k for a lung transplant…well…better crack open the piggy bank….you made your life choices…you can no longer force your co-workers and/or society pay the tab for your decisions. Same goes for the myriad of other health woes caused by personal choices.

The bottom line is…the current healthcare delivery model in this country is all kinds of screwed up. An employer should be able to offer an employee a specific wage for a specific job just as I can walk into a grocery store with $3 and walk out with a gallon of milk.  Until we have that, it is going to be very difficult for all young and unskilled workers to find employment
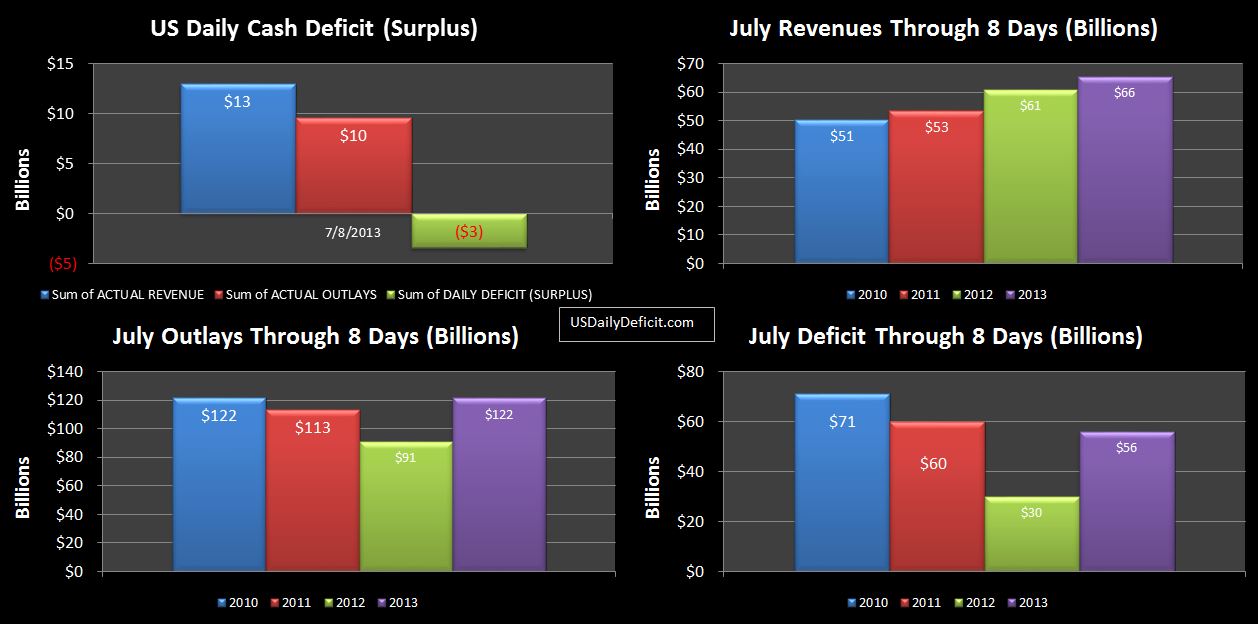


7/08/2013 Daily US Cash Deficit

By | Daily Deficit

The US Daily Cash Surplus for 7/8/2013 was $3.4B on typically strong Monday cash receipts. Revenues are up YOY by 7%, but it will probably be a week or two before that firms up…. there can be a lot of variability. The rest of the month should be rather uneventful….just the large SS payments for the next 3 Wednesday’s, and some corporate tax deposits likely on the 15th. I still have my guess at around an $80B deficit to end the month, but I will revisit in a few weeks and we have enough data to make a better guess.

07-08-2013 USDD

We haven’t looked at this in a while, but the cash balance is now $92B. If we run another $25B for the rest of the month, we enter August with ~$67B….I am projecting about a $125B deficit for that month, leaving a $58B shortfall. however, Treasury has a knack for creating imaginary money and $58B…given their previous magic tricks…I have no reason to doubt they can come up with $58B to get through August somehow. If they get through August and the first few days of September…making it to October should be a breeze since September will see heavy cash inflows as a quarter end. That makes October the do or die month for the debt ceiling. At that point, cash will be down to near nothing, and we will be staring at a couple of $100B+ deficits in October/November….I don’t think they can squeeze $200B out of “extraordinary measures”…so Right now, I’ll peg the drop dead date at October 3rd at the latest….the day about $25B of Social Security payments need to be made. Just to recap….This assumes tax revenues continue to come in about 10% over last year, and that Treasury can squeeze another 60+B or so out of extraordinary measures between now and early September.

Proof (well…circumstantial evidence) Social Security Implemented As Stealth Income Tax

By | Commentary

A while back I wrote a post titled Uncle Madoff Sam’s “Social Security Trust Fund” which was a tongue in cheek look at Social Securities Ponzi beginnings… excerpt below

Bernie Madoff Sr. 1935 (BM) : Ok everybody step right up. Have I got a deal for you today!! All you have to do is give me 15% of your paycheck from the day you turn 18 until the day you turn 62, 65, 67, 70?? In exchange for this modest contribution, I will, at my sole discretion, give you a meager monthly benefit until the day you die.

To back up a bit, it has been a hypothesis of mine that Social Security was invented not as a program to help the all the poor widows living in poverty like the history books say, but instead, as a disguise to pass a broad income tax that would (at least temporarily) bring in far more revenue than outlays, allowing the government to spend that revenue wherever they wanted, leaving future elected officials to worry about the promises being made.

The story line kind of fits….right in the middle of the depression, people are generally unhappy with the government and probably not in the mood for a tax hike. However, revenues are depressed, and outlays are surging….what to do? Create a fake program to help widows and the elderly and a broad based tax to pay for it. Then…set the retirement age so high…most people will die before they are old enough to collect and voila!! It’s not like the public could download the data into excel and crunch the numbers themselves back then, who was gonna know the difference?

So that has been my hypothesis, but I never had any raw data to correlate with it…until now. Over at SSA.gov I found a neat little table showing Social Security’s  annual cash inflows and outflows…all the way back to 1937. Then, at findthedata.org I found the total US government historical revenues and outlays. Put them together, and the evidence is pretty convincing.

First, lets set the backdrop…From 1920 to 1930, the government ran 11 consecutive surpluses averaging $4.3B in revenues and $3.5B in outlays. Just scaling that up to 2012, that would have been like pulling in $4.7T of revenues on 3.9T of outlays…good for a $900B annual surplus….instead of the $1.1T deficit we actually recorded. Then…just do that 11 years in a row.

Then…the Depression hits. Revenues fall more than half from $4.1B in 2030 to $2.0B in 2032. Outlays…$3.3B in 2030 grow 40% to 4.7B by 2032, on their way to 8.2B in 1936. All of a sudden, after more than a decade of healthy surpluses, the government is spending more than twice what it brings in. By the end of 1934, the surpluses of 1920-1930 have been more than wiped out, with nothing but huge deficits on the horizon. They can only issue so much debt (Quantitative Easing hadn’t been invented yet)…they desperately need a new revenue stream, but raising taxes on a pissed off population doesn’t always end well. Enter Social Security. Passed in 1935….implemented in 1937.

So…anyone want to guess what the payout in year one was? Today it’s roughly 1:1. in 1937, according to the SSA, the SS tax brought in $737M of revenue..a full 14% of the federal government’s $5.4B total revenues in 1937. That would be equivalent to today, a $420B per year tax hike. Does anyone think Obama could get that passed? Total Social Security outlays that year… $1M. That’s right…they brought in 737M, and paid out $1M.

Ok…maybe it was just a fluke, maybe you had to wait a year or something, and Y1 only had admin expenses. Let’s look at Y2. $10M paid out on $375M of revenues…2.3% payout. Between 1937 and 1950, SS brought in $18.1B of revenues, and paid out $4.4B…paying out less than 25% of revenues. Not exactly what you expect from a Ponzi pay as you go program to help widows. No…Social security was designed from the start to be a broad based income tax to fund general government, and on the side (as a cover)… they would use a very small % of proceeds to take care of the few who managed to live to retirement age and fill out the right paperwork (typically before dying a few months later)

After a great start… by 1957 (Damn you FDR!!!), the math was starting to catch up and Social Security was running a deficit. And so it started. Taxes were raised… problem solved for a few years, until the math caught up again. Rinse, repeat, and here we are again… What will we do with the “Little Ponzi Scheme That Could”?

Hell if I know!! How do you tell 40M voting seniors and 60M  near retirement Boomers they’ve been paying into a Ponzi scheme 10,000X bigger than Bernie Madoff’s for their entire lives. The money is gone, and the only way to continue it is to screw over the younger generation even more than they already did with Obamacare. Also…they(the young) are young and stupid…you are old and frail…. (so it’s even right 🙂 ) I don’t know how it ends, but I am sure it’s gonna be bad for someone.

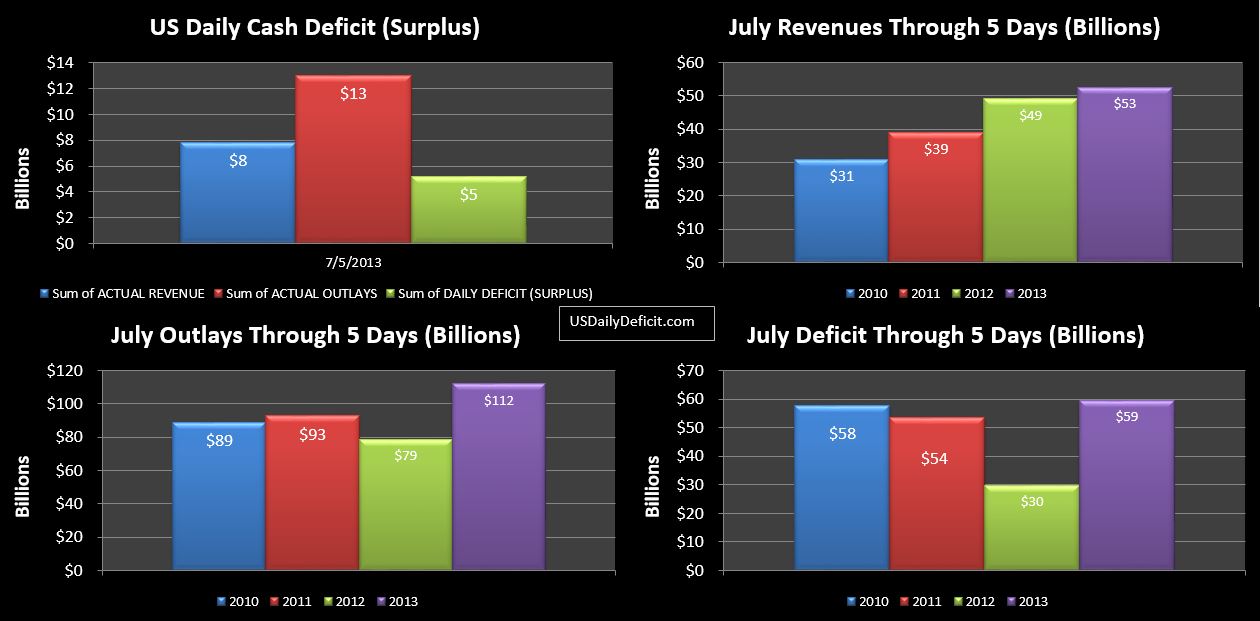
7/05/2013 Daily US Cash Deficit

By | Daily Deficit

The US Daily Cash Deficit for 7/5/2013 was $5.2B bringing the July Deficit through 5 days to $59B. Although it’s only 4 business days, we have more or less a comparable full week to 2012…Revenues are up 7%. Cost…if we add back the $30-35B to July 2012 that was actually paid in June, we are pretty close to even. It’s still too early to tell, but 7% is a healthy gain so far (better than a decrease) and I would expect to build somewhat on that…especially with one extra business day over 2012 which we would expect to add about 5% or so of revenues and cost. So…looks like same old story…flat cost  and ~+10% or so revenue gains. It’s a really good story….let’s hope it doesn’t end soon.

07-05-2013 USDD

For Every Debit….A Credit (somewhere) – Accounting For Stock Gains

By | Commentary

I always get a kick out of this type of article “Dow Will Hit 60,000 In 20 Years“. Hooray…we’re all saved right….all you have to do is keep pouring 5-10% of your income into your 401k, and we will all retire like kings…say the current kings…happy to get rich skimming a bit off the top.

So…let’s imagine for just a moment that we woke up tomorrow, and the DOW…along with the rest of the stock market pulled a clean quadruple…and we hit Dow 60,000. Hooray…we’re all rich. We can all hire maids, nannies, gardener’s, and best of all, a couple Bugatti Veyrons to park in the garage of our fancy new houses. Right??

That sound great, and kinda makes sense, but to the accountant in me…I’m always wondering…what’s the other side of the entry, because for every debit, there must be a credit. So let’s think our way through it. We wake up in the morning, and the stock market has quadrupled, but nothing else has changed. We still have the same factories, machinery, buildings and shops. The stock of tangible assets is the same.

So….let’s look at two nearly identical families who have made different investment decisions. Family A has decided to invest their savings in real estate, owning free and clear a $250k home. Family B, on the other hand, has decided to invest their savings in the stock market…also $250k.

When these families wake up the next morning….they suddenly find themselves very unequal. Family A more or less feels the same….for now. Family B, on the other hand feels like they have won the lottery…just like every other owner of stock. Family B’s wealth is now 4X of Family A….all else equal. On this, I think we can agree. What may not be so apparent is that while Family A’s wealth…as measured in dollars appears to have stayed the same, the truth is, their wealth has been severely diminished by the rise in the stock market.

Lets step back and look at the economy as a whole. Assume that before the stock market quadrupled, there was $20T of wealth…$10T tangible (physical assets), and $10T intangible (stocks) After the event, the measured wealth is $50T…$40T intangible, and $10T tangible. At least…measured in dollars. But currency is…as a measuring tool, a pretty piss poor device. Over time, a secondary reallocation event will occur, making it crystal clear that no new wealth has been created. The spike in the stock market simply results in a transfer of real wealth to stock owners, at the expense of non stock owners.

Let me present another similar example…lets go back to the 2003-2008 time period…where the price of oil went from $30-150 (and ultimately back to $30) Economists and pundits screamed as each milestone was broken. $40, $50, $100, $125…. They would go on and on about how this hurt the consumer, and was hurting the economy. They obviously hadn’t been to Houston. I was in oil and gas at the time, and while the pain the consumers were seeing were real….there is a debit for every credit. As the price of oil rose…consumers saw their wealth decreasing….it took more hours of work to pay for the same amount of fuel. The oil business saw the other side of the equation….Our work was suddenly valued more…the one bbl of oil that used to only buy a dinner at Chili’s with the missus….could now buy dinner and booze at the nicest steakhouse in town. Wealth had been transferred from one large diverse population…consumers, to producers of oil. Ignoring the international aspect and looking globally….I would say that more or less…no wealth was created or destroyed. Wealth remained the same, but was reallocated among the”winners” and “losers”

Now, our two examples have used very large divergances…the price of oil going from $30 to $150 and a theoretical quadrupling of the stock market to illustrate the mechanism of what is going on at a much smaller scale all day every day….prices of everything are constantly in flux….both against the dollar (which itself changes), and more importantly, against each other. All of these result in small, and typically invisible transfers in wealth from the losers to the winners.

So…let me wrap this up and try to make my point. I guess I am saying that from a global perspective….it makes absolutely no difference what the stock market does….certainly not in the short run, and probably not in the long run. Today…the stock market is up about 0.5%. So owners of stock are obviously a little bit richer, and not so obviously non stock owners are a little bit poorer. If tomorrow stocks are down 0.5%…the exact opposite will happen. This is a completely different reality than the market myth that has been perpetuated for nearly a century….that a rising stock market creates genuine wealth for all. It doesn’t, it never has, and it never will. Economists, like most homo sapiens are quick to count the debit they can see while ignoring the credit just out of sight. The truth is, the stock market is just like the horse track, only the race never ends. Every day, there are winners and losers, but they all net to zero.